
Strong reporting is an incredibly valuable communication tool—no matter your industry. It helps you distill information and present it effectively, and it provides the transparency that supports a happier company culture.
But reporting can serve an important purpose beyond communicating with your clients or your department. It can become interesting content that expands your reach, showcases your brand personality, and provides genuine value to people. If you’re looking for new content marketing inspiration, your company’s most recent report might be your next piece of PR gold.

7 Ways to Use Reporting in Your Content Marketing
From culture marketing to brand awareness, reports can help brands in many ways. But what exactly does that look like? Here’s how these clever brands have turned their surveys, reports, data, and insights into fantastic content that helps them connect and engage with the public.
1) LinkedIn’s Workforce Report
How they use reporting: To support their vision.

LinkedIn’s vision is “to create economic opportunity for every worker in the global workforce.” They do this through their social platform, but they also create content that helps people find and navigate their careers more effectively.
Their Workforce Report plays a huge role in this. Each month, the report consolidates insights from LinkedIn’s platform, including 133 million U.S. worker profiles, 20,000+ company profiles, 3 million+ job listings, and 50,000 skills listed on profiles.
The public report covers trends and insights by industry, including more than 100 data graphics. This up-to-date data is a tremendous resource for job seekers, hiring managers, members of the media, and anyone interested in the state of the U.S. workforce—helping LinkedIn fulfill its vision one report at a time.
Find out why your brand’s best stories come from your internal data, and get a behind-the-scenes look at how we help LinkedIn produce those 100+ charts each month.
2) Gartner’s Magic Quadrant
How they use reporting: As an investment tool

Gartner’s Magic Quadrant reports analyze specific tech industries to identify the major competitors in the market, including leaders, visionaries, niche players, and challengers. The quadrant visualizes each competitor’s position in the market, making it a helpful tool for investors to assess the landscape and identify potential investments.
Going a step further, Gartner also provides interactive Magic Quadrants, which let investors customize reports for their specific business goals and needs. In this way, Garner provides an incredibly powerful tool that turns valuable data into truly actionable insights.
Good reporting always provides something, whether it’s education, inspiration, or entertainment. Follow these 7 tips to make sure all content you create provides value.
3) MailChimp’s 2016 Annual Report
How they use reporting: For culture marketing

Annual reports are traditionally used to inform investors of the more boring sides of business: financial data, initiative recaps, etc. But the best annual reports showcase a brand’s accomplishments, as well as a brand’s personality. For MailChimp’s 2016 Annual Report, the company gave viewers an inside look at their team, their passions, their major milestones, and day-to-day office life via an interactive report.
Presented with bright and bubbly on-brand design (think bananas and monkeys), the report features a seemingly endless scroll of interesting tidbits, from the type of night school classes employees took (calligraphy, Ruby, desk plants, database management, improv, Git, and Snapchat) to the number of employees who marched in the Atlanta Pride parade. These snapshots, both big and small, give you a strong sense of the people behind the brand, including how they work and what they care about.
To make sure your annual report makes an impact, follow these 7 tips.
4) Incapsula’s “Are You Slacking Off?” Infographic
How they use reporting: As thought leadership

As MailChimp proves, not all reports have to copy the boring aesthetic of traditional corporate reports. And you don’t always have to present an entire report to provide value. To promote their 2017 SaaS Uptime Survey, Incapsula turned survey insights into an animated infographic that’s both informative and eye-catching.
Presenting survey highlights in a distilled form is its own service (for busy readers who can’t read the whole survey), and presenting it in a shareable and engaging visual format makes it more digestible. (This type of content is especially great to pitch to publishers who cover similar topics.)
Follow Incapsula’s lead and try a divisible content strategy to get the most mileage from any content your create.
5) Siemens’ Sustainability Reports
How they use reporting: As behind-the-scenes content
Sustainability reporting has become more pervasive, which is a great thing for consumers. But the information tends to be dry and dense. Siemens is taking a creative approach to sharing that information. Through The Magazine, the brand’s publication, they bring sustainability report stories to life, going behind the curtain to visit the people and places that are making an impact. Their mini-documentaries series is especially interesting, shining a literal spotlight on their sustainability practices.
Brand video is on the rise. Find out why a video strategy can help you achieve your marketing goals.
6) Pantone’s Color Institute Colour Trend Report
How they use reporting: As editorial content

Color trends influence all creative fields, but possibly none so much as fashion. As such, Pantone steers conversations around color by releasing the color trend reports every fashion season. The palettes feature the top 12 colors found most frequently on the runway, along with the Adobe Swatch files for download. This serves as a valuable reference for creators and influencers while putting Pantone front and center.
While not everyone is interested in fashion, there are psychological reasons we share content we’re interested in. Knowing more about these can help you come up with stronger content ideas.
7) ALSO’s 2016 Annual Report
How they use reporting: To show their expertise
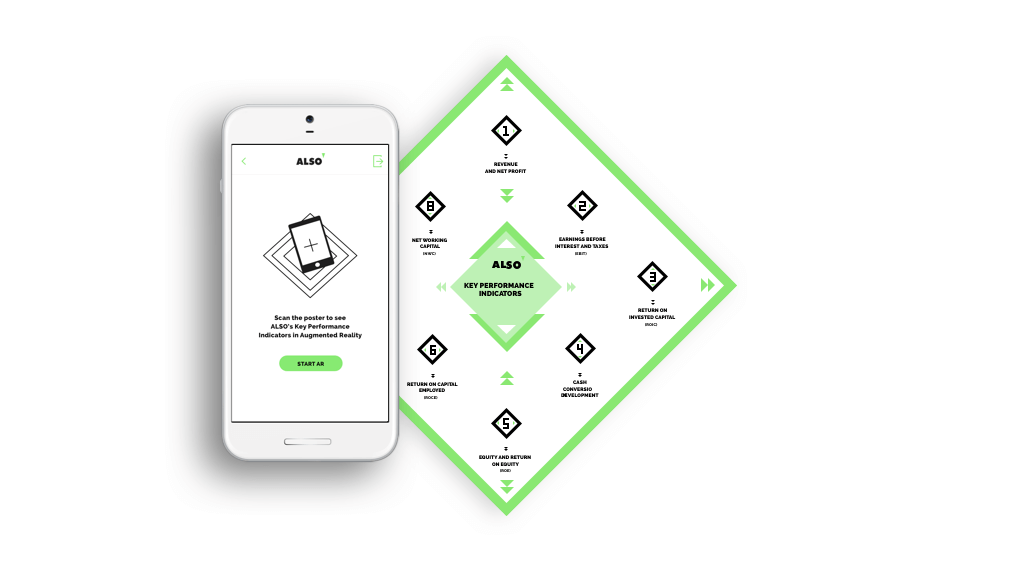
You may have never heard of ALSO, a B2B marketplace for Information and Communication Technology, but you may be inspired by their insanely creative annual report presentation.
To celebrate one of the most exciting innovations in their field, the company turned their annual report into a Virtual Reality and Augmented Reality experience. The report included a VR app exploring ALSO’s various business models, as well as an Augmented Reality poster to be scanned via smartphone. This impressive presentation showcases their creativity, their passion for their industry, and their innovative thinking.
For more inspiration, see 5 other brands that nailed their annual report.
How to Turn Your Reports Into Great Content
If you’re inspired to use your reports for content marketing, start with the stuff you have access to and follow these tips:
- Take a look at these 9 sources of company data you probably already have.
- Use this step-by-step guide to find the stories in your data.
- Learn how to tell your brand story through any piece of content.
- Avoid these common design mistakes.
- Get the most from your content by creating a solid distribution plan.
If you need any help with your content, holler at us.


Comments