USA Today has long been known as a pioneer in the news industry for its use of infographics—particularly for its USA Today Snapshots®, which are illustrative charts and visualizations used on the front page of each section. These small data sets provide readers with short, easily digestible information about some of the larger news topics of the day. We were honored early last year when the team commissioned us to help refresh its infographic style and visual language to coincide with a rebranding that was already underway with Wolff Olins.
Considering the news organization’s globally-minded, visually-driven readership, we needed to build a cohesive graphic system that unified its extensive use of charts with the overall brand, while providing enough flexibility to meet the many applications these would have in reporting the news.
A New USA Today Visual Language
Market research reveals that USA Today‘s readers typically seek short, easily digestible bits of information with graphical elements, on a variety of subjects. With this in mind, our task was to create a comprehensive and cohesive visual language spanning all aspects of the charts, calendars, tables and maps that the organization commonly uses, to ensure all future graphic usage is easily recognizable and consistent with USA Today‘s new brand.

Presenting various mood boards and style samples at the onset of the project enabled an open dialog with USA Today‘s team to hone in on the general look they felt fit their brand.
To tackle such a complex task, we examined many of the charts they use most regularly. We started with a wealth of visual information at our disposal, scouring more than 100 pre-existing graphics in USA Today‘s digital library. From there, we created mood boards to gauge the aesthetic feel that most aligned with the organization’s branding.

Graphic samples ranged from simplistic to highly detailed. We recommended a simplified style, because the graphics need to function across a multitude of published works.
Using an extensive process of exploration and experimentation, we began to define the applicable style. With so many opportunities for clutter, USA Today sought to reframe the brand with a unifying bold, clean and structured aesthetic. As a news organization, the clarity of communication was a driving factor in our ongoing dialogue throughout development, and our aim was to tie in closely and cohesively with the rebranding soon to be implemented.
Throughout this exploration, we focused on the designs that could be applied simply and effectively among all the charts in order to create a cohesive feel. From this, we were able to build a system for designing infographics that is consistent with the updated branding system. Developing visual guidelines ensures maintained integrity of the data displayed and aesthetic appeal, as well as relatively simple recreation for USA Today‘s graphics department.

In a chart exploration, we depicted various color schemes and ranges of design that could be applied for each type.
To help implement this new visual language, we created a detailed guide to define the proper use of everything from typography and iconography to patterns and color. We also provided specific guidelines for creating each of the 11 different chart types and data visualization elements. These rules outline the best charts to use for various data relationships and the correct methods for ordering and labeling each element.
With this style guide, USA Today is able to streamline its infographic-creation process, ensuring that, in such a vast and fast-paced organization, their quality will not be compromised and brand integrity will be maintained.
Here’s a look at some of the finished product:
![]() Icons are easily identifiable, with minimal detailing, so as not to distract from the overall graphic.
Icons are easily identifiable, with minimal detailing, so as not to distract from the overall graphic.
 Guidelines for the use of a column chart.
 Heat map color palettes.

Newspaper spread of maps and bar charts depicting 2012 U.S. presidential election results.

Icons and bar charts in print.

USA Today newspaper map depicting weather changes throughout the United States.

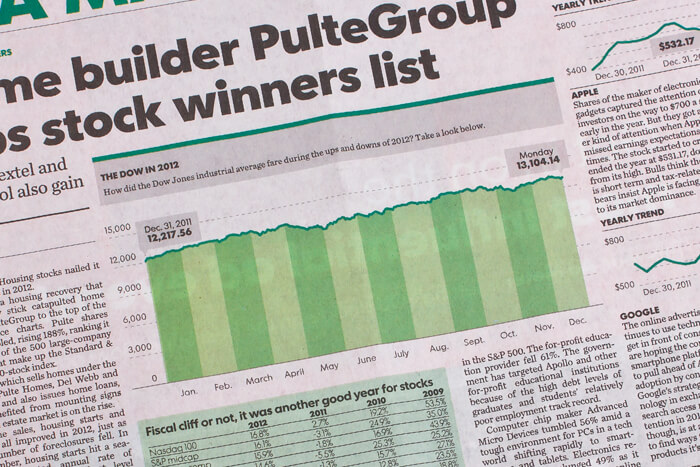
Line graph depicting stock market changes over time, from USA Today newspaper.
Need help revamping your own visual language? Find out what it’s like to work with us on your brand identity, or reach out directly. We’d love to help you bring your brand to life.