Although infographic marketing has been around for a decade (and 65% of marketers use infographics, according to the Content Marketing Institute’s 2018 Benchmarks report), we still see brands make rookie mistakes when it comes to optimizing an infographic for SEO. According to a 2017 HubSpot study, 61% of marketers say increasing organic visibility is their highest inbound marketing priority, yet so many leave their infographics and blogs unoptimized. This is incredibly frustrating to see, as organic traffic is so important—for your keywords, your social shares, and more. But instead of scolding, we’re here to show how to improve SEO, according to best practices.

How to Improve SEO for Every Infographic
Here, you’ll find our simple guide to optimizing your infographic for SEO, including a few tips, an infographic, and a checklist to make it easier. (Seriously, it’s everything you need.) So next time you’re getting ready to hit publish, follow these steps to set yourself up for success.
Step 1) Find Your Optimization Keyword
If you want to know how to improve SEO, you need to If you want your brand to be the first thing people see when they search, you need to focus on a single keyword or phrase.
For example, as a content marketing agency specializing in infographics and data visualization, we like to create content related to those topics so that our services are more visible when people search those related keywords. For this post, we’re targeting the phrase “infographic for SEO.” Hence, you’ll see that phrase used throughout this post.
For you, finding the right keyword is crucial. You want something you can realistically rank for (while ensuring it’s relevant to your niche). To find the right keywords, check out HubSpot’s beginner’s guide for doing keyword research.
Pro tip: Going forward we’d recommend identifying keywords before creating content; that way you know your infographics are always relevant to your keyword.
Step 2) Optimize Your Infographic for SEO
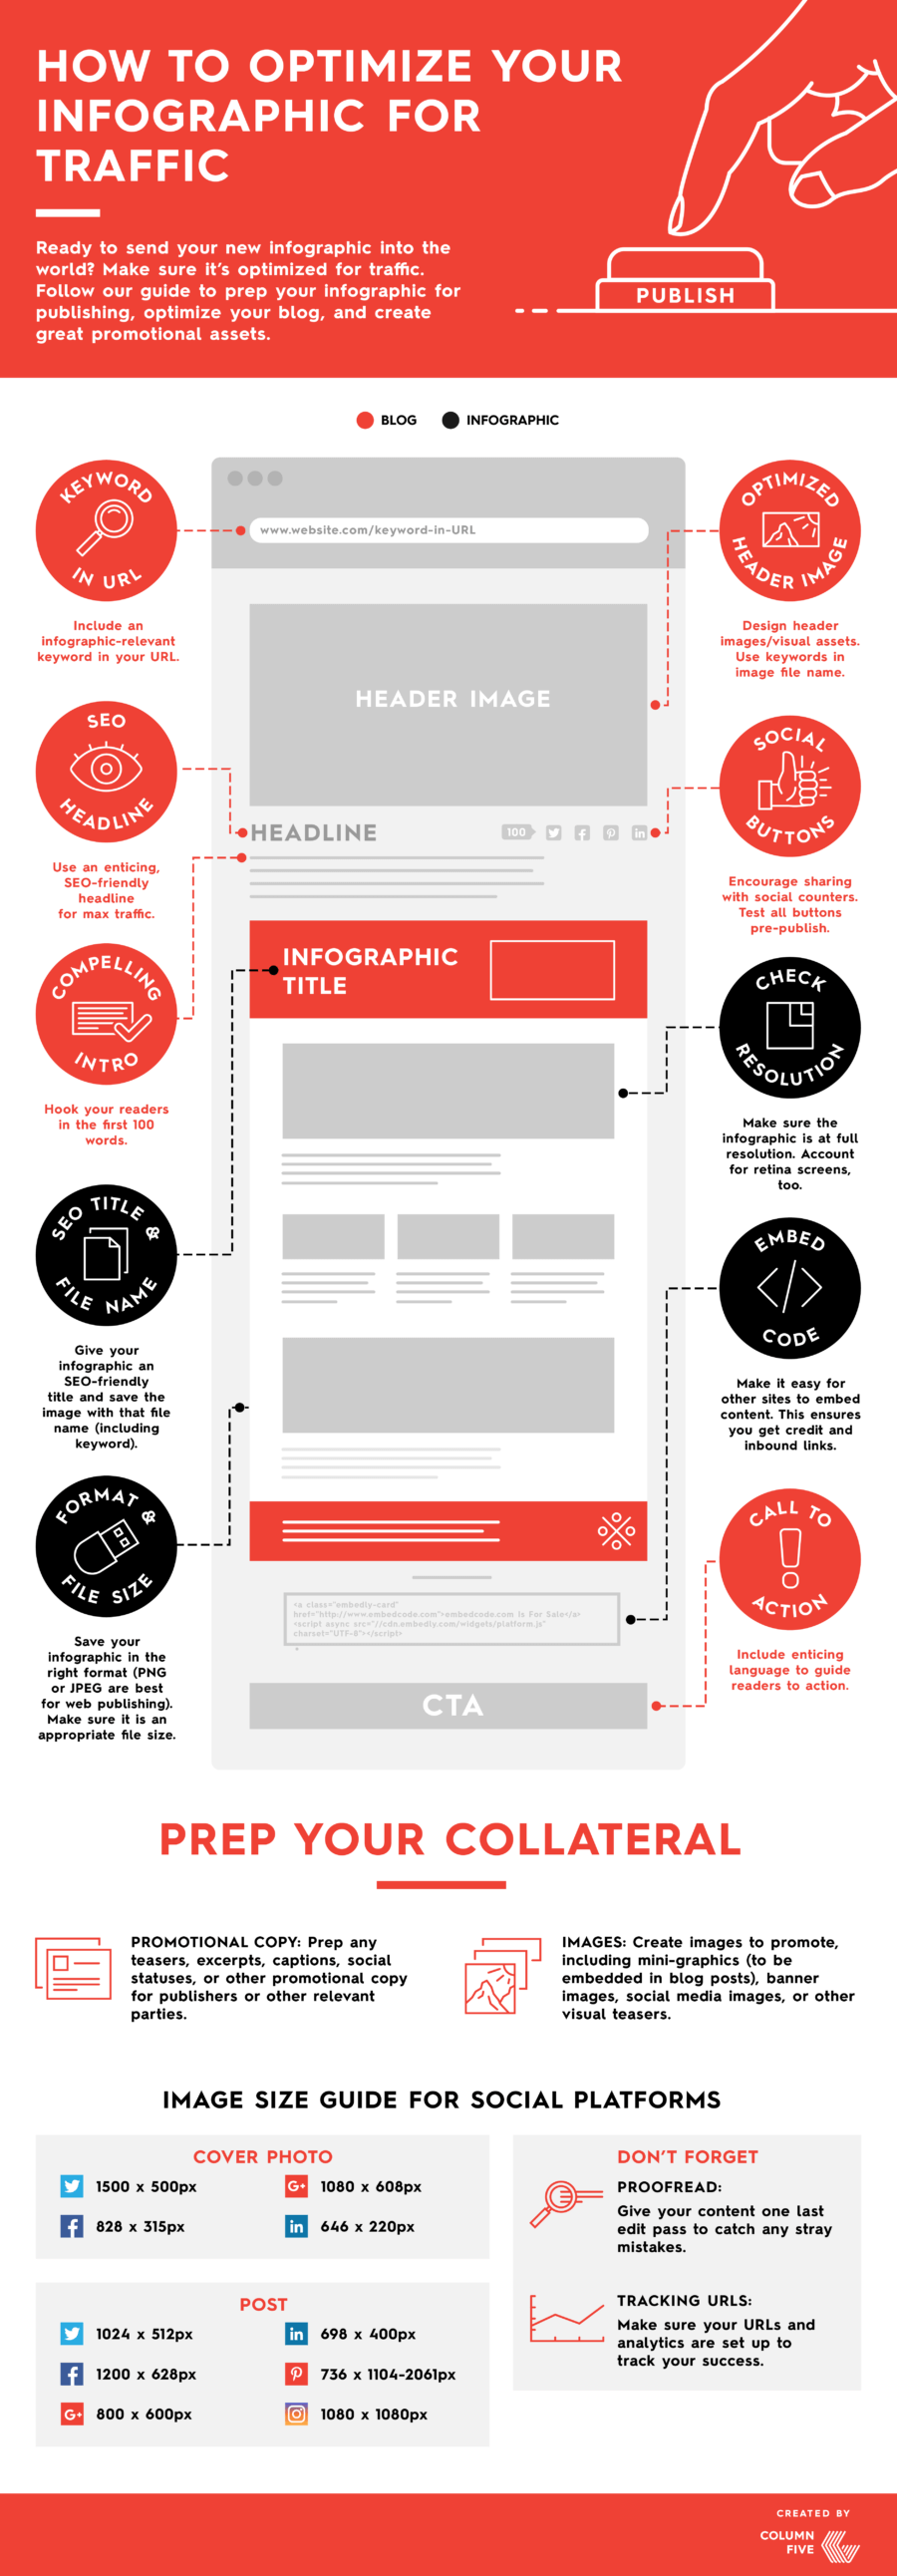
Once you know your keyword, you’re ready to optimize your infographic for SEO. While it may seem like many of these things are small details, it’s crucial to complete all of these steps to optimize appropriately. We’ll run down the list here, and because we like you, we’ve also created an infographic version below.
WHERE TO ADD YOUR KEYWORD:
- URL: If you’ll notice, the phrase “infographic for SEO” is in this post’s URL. Make sure the keyword phrase is clearly placed within your post’s URL, as it’s an important element that search engines use for ranking.
- Headline: Write a catchy headline that includes the keyword.
- Meta description: Add a compelling meta description and include the keyword there.
- H1 headings: Add your keyword phrase in the H1 heading, as well as any other relevant headings.
- Image filenames: Make sure your infographic image file is saved at the right resolution, and includes the keyword in the filename. The same goes for any blog banners or article images to accompany the post. (See the infographic below to make sure your images are sized appropriately for every platform, too.)
- Image alt text: Because search engines can’t crawl the content of images (they simply acknowledge that there is an image), you must tell the search engines what your images are. That’s where alternative text comes in. If you create an infographic about the best restaurants in New York, you’d probably want to post it using the alt text “Best New York Restaurants Infographic.”
HOW TO OPTIMIZE YOUR INFOGRAPHIC PAGE:
- Include a decent word count: Search engines take into account other page features when crawling a blog post, including page length. Search engines like longer posts, especially if they are optimized correctly. Try to get your posts to at least 1,000 words, and make sure you include keywords throughout.
- Watch your load times: Make sure your page is loading quickly and correctly. If the page takes forever to load, Google will be less likely to offer it as a suggestion to viewers. Here’s a free tool that will let you know how Google is judging your page load time. (Note: Watch your bounce rate, too. Similar to page load times, Google’s main priority is to serve up content that is valuable to searchers. If you have an incredibly high bounce rate, Google assumes people aren’t interested in the content of the post and won’t show it in the search engine results page.)
- Optimize your social sharing buttons: Sharing is crucial to get more traffic. Make sure your share buttons are working and visible.
- Have visible CTAs: Don’t let your traffic go to waste. Provide a next action to help convert, whether it’s a download, subscribe button, or other CTA.

Note: If this all seems a bit much or too overwhelming to remember, there are SEO plugins that simplify it for you. For example, our entire website is run via WordPress, and we use an SEO plugin called Yoast that ensures our pages hit our SEO checklist before hitting publish.
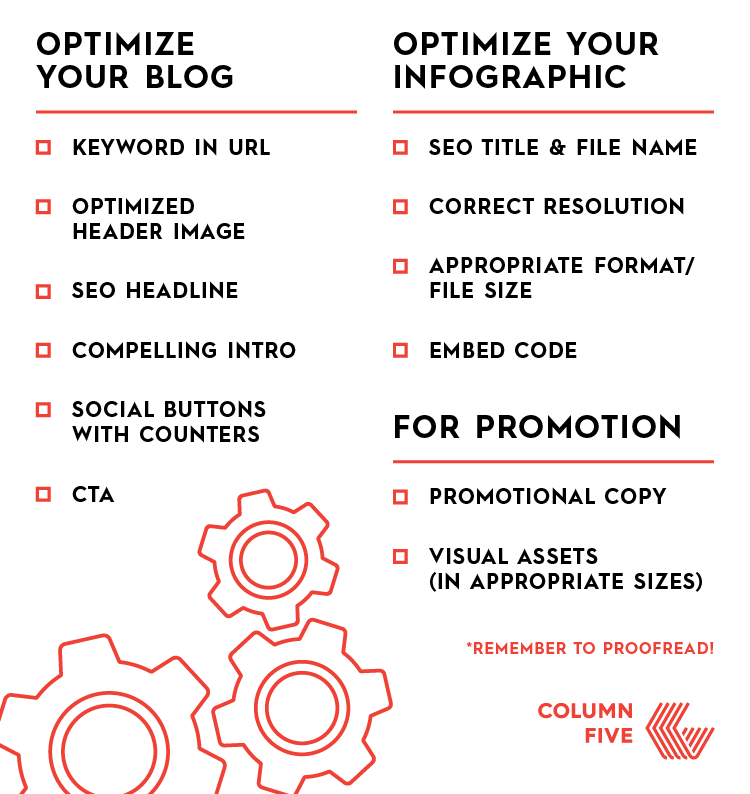
You can also use this handy checklist to ensure your team optimizes every infographic (or other piece of content) correctly. Feel free to share, print, or bookmark it.

Step 3) Consider Re-Optimizing Underperforming Content
If you have an archive of infographics that haven’t been properly optimized for SEO, now is the time to revisit those. Refreshing old posts with optimized headers, titles, and keywords, as well as additional content and images, is a great way to get extra traffic. We’ve done this for some of our older posts and found an average 20% increase in organic traffic.
Learn How to Get More Traffic with Better Distribution
We hope these tips for how to improve SEO have been helpful, but know that organic search isn’t the only way to get eyes on your content. Earned media is also especially valuable. To find out how to reach publications and influencers, as well as others…
- Learn how to get featured in major media by using a publication-tailored content strategy.
- Use this guide to determine the best distribution channels for your content.
- Follow these tips to promote your infographic like a content agency would.
- Download our Ultimate Guide to Content Distribution e-book for more helpful tips.
That said, if you could use a little help getting more eyes on your content, let’s talk about the best strategy for you.


Comments