Media Use in the Middle East
Northwestern University
Media Use in the Middle East, 2015, is the third iteration of an annual study by Northwestern University in Qatar that studies media use and cultural and political attitudes in Arab countries. More than 6,000 respondents across six Arab countries were selected and interviewed via randomized sampling procedures, constituting nationally representative samples in Egypt, Lebanon, Qatar, Saudi Arabia, Tunisia, and the United Arab Emirates. The 2015 survey replicated many questions asked in 2013, so for the first time in the life of this project, we are able to see how things have changed over a two-year period. This project is one of our favorite annual projects because we get to work with more than 5 million cells of data and experiment with new trends in visual content.
We collaborated with Northwestern University to create this year’s:
- Survey microsite
- Interactive data explorer tool
- Derivative microcontent for social distribution
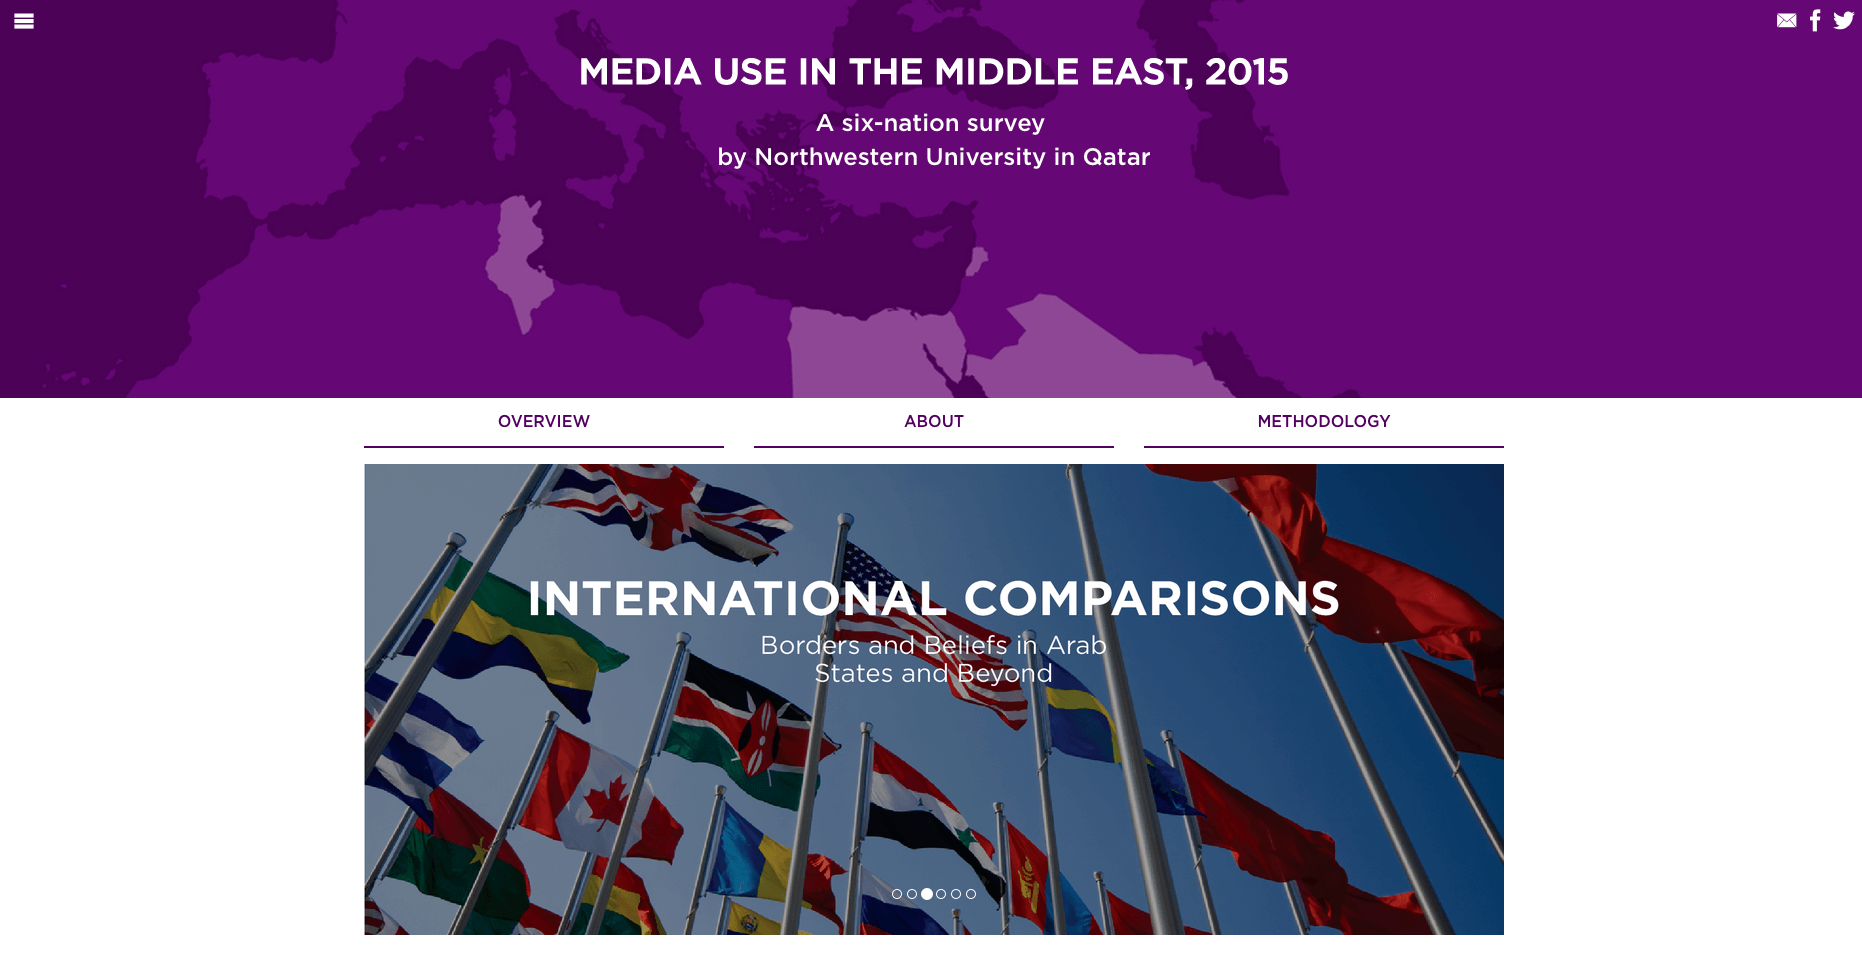
MICROSITE
Because of the testing information we gathered from prior user experience, this year’s website was structured a bit differently than before. Previously, we segmented the site with separate website pages for each section of content, but we found that users weren’t engaging with it. Users would read one page, then bounce. With that information at hand, we changed our structural approach, treating sections less as separate entities and more as comprehensive portions of a whole. We moved away from the multi-page approach to a more publication-style layout. Functionally, this means users can scroll through large amounts of content or use “jump” navigation points to engage with specific content. By displaying all the content on one page, we’re seeing longer time-on-site results and higher social engagement than last year.

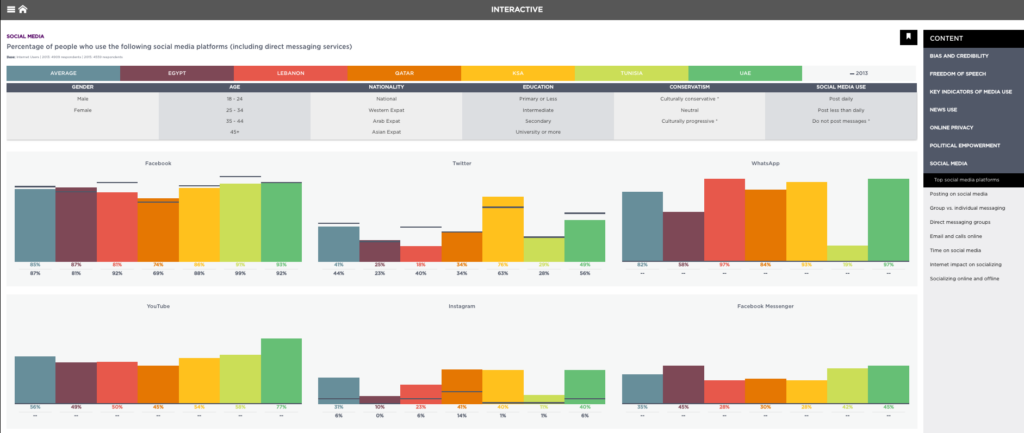
INTERACTIVE
The Media Use in the Middle East survey is a very sound academic survey that produces a lot of really great insights; however, those insights historically have been difficult to identify. The solution was an interactive data explorer that enables users to not just see survey results but also filter them based on demographic data. With more than 5 million cells of data, we needed to create a custom API able to handle large query strings without impacting performance. Even if you don’t know anything about the survey, it’s a fun tool to play with.
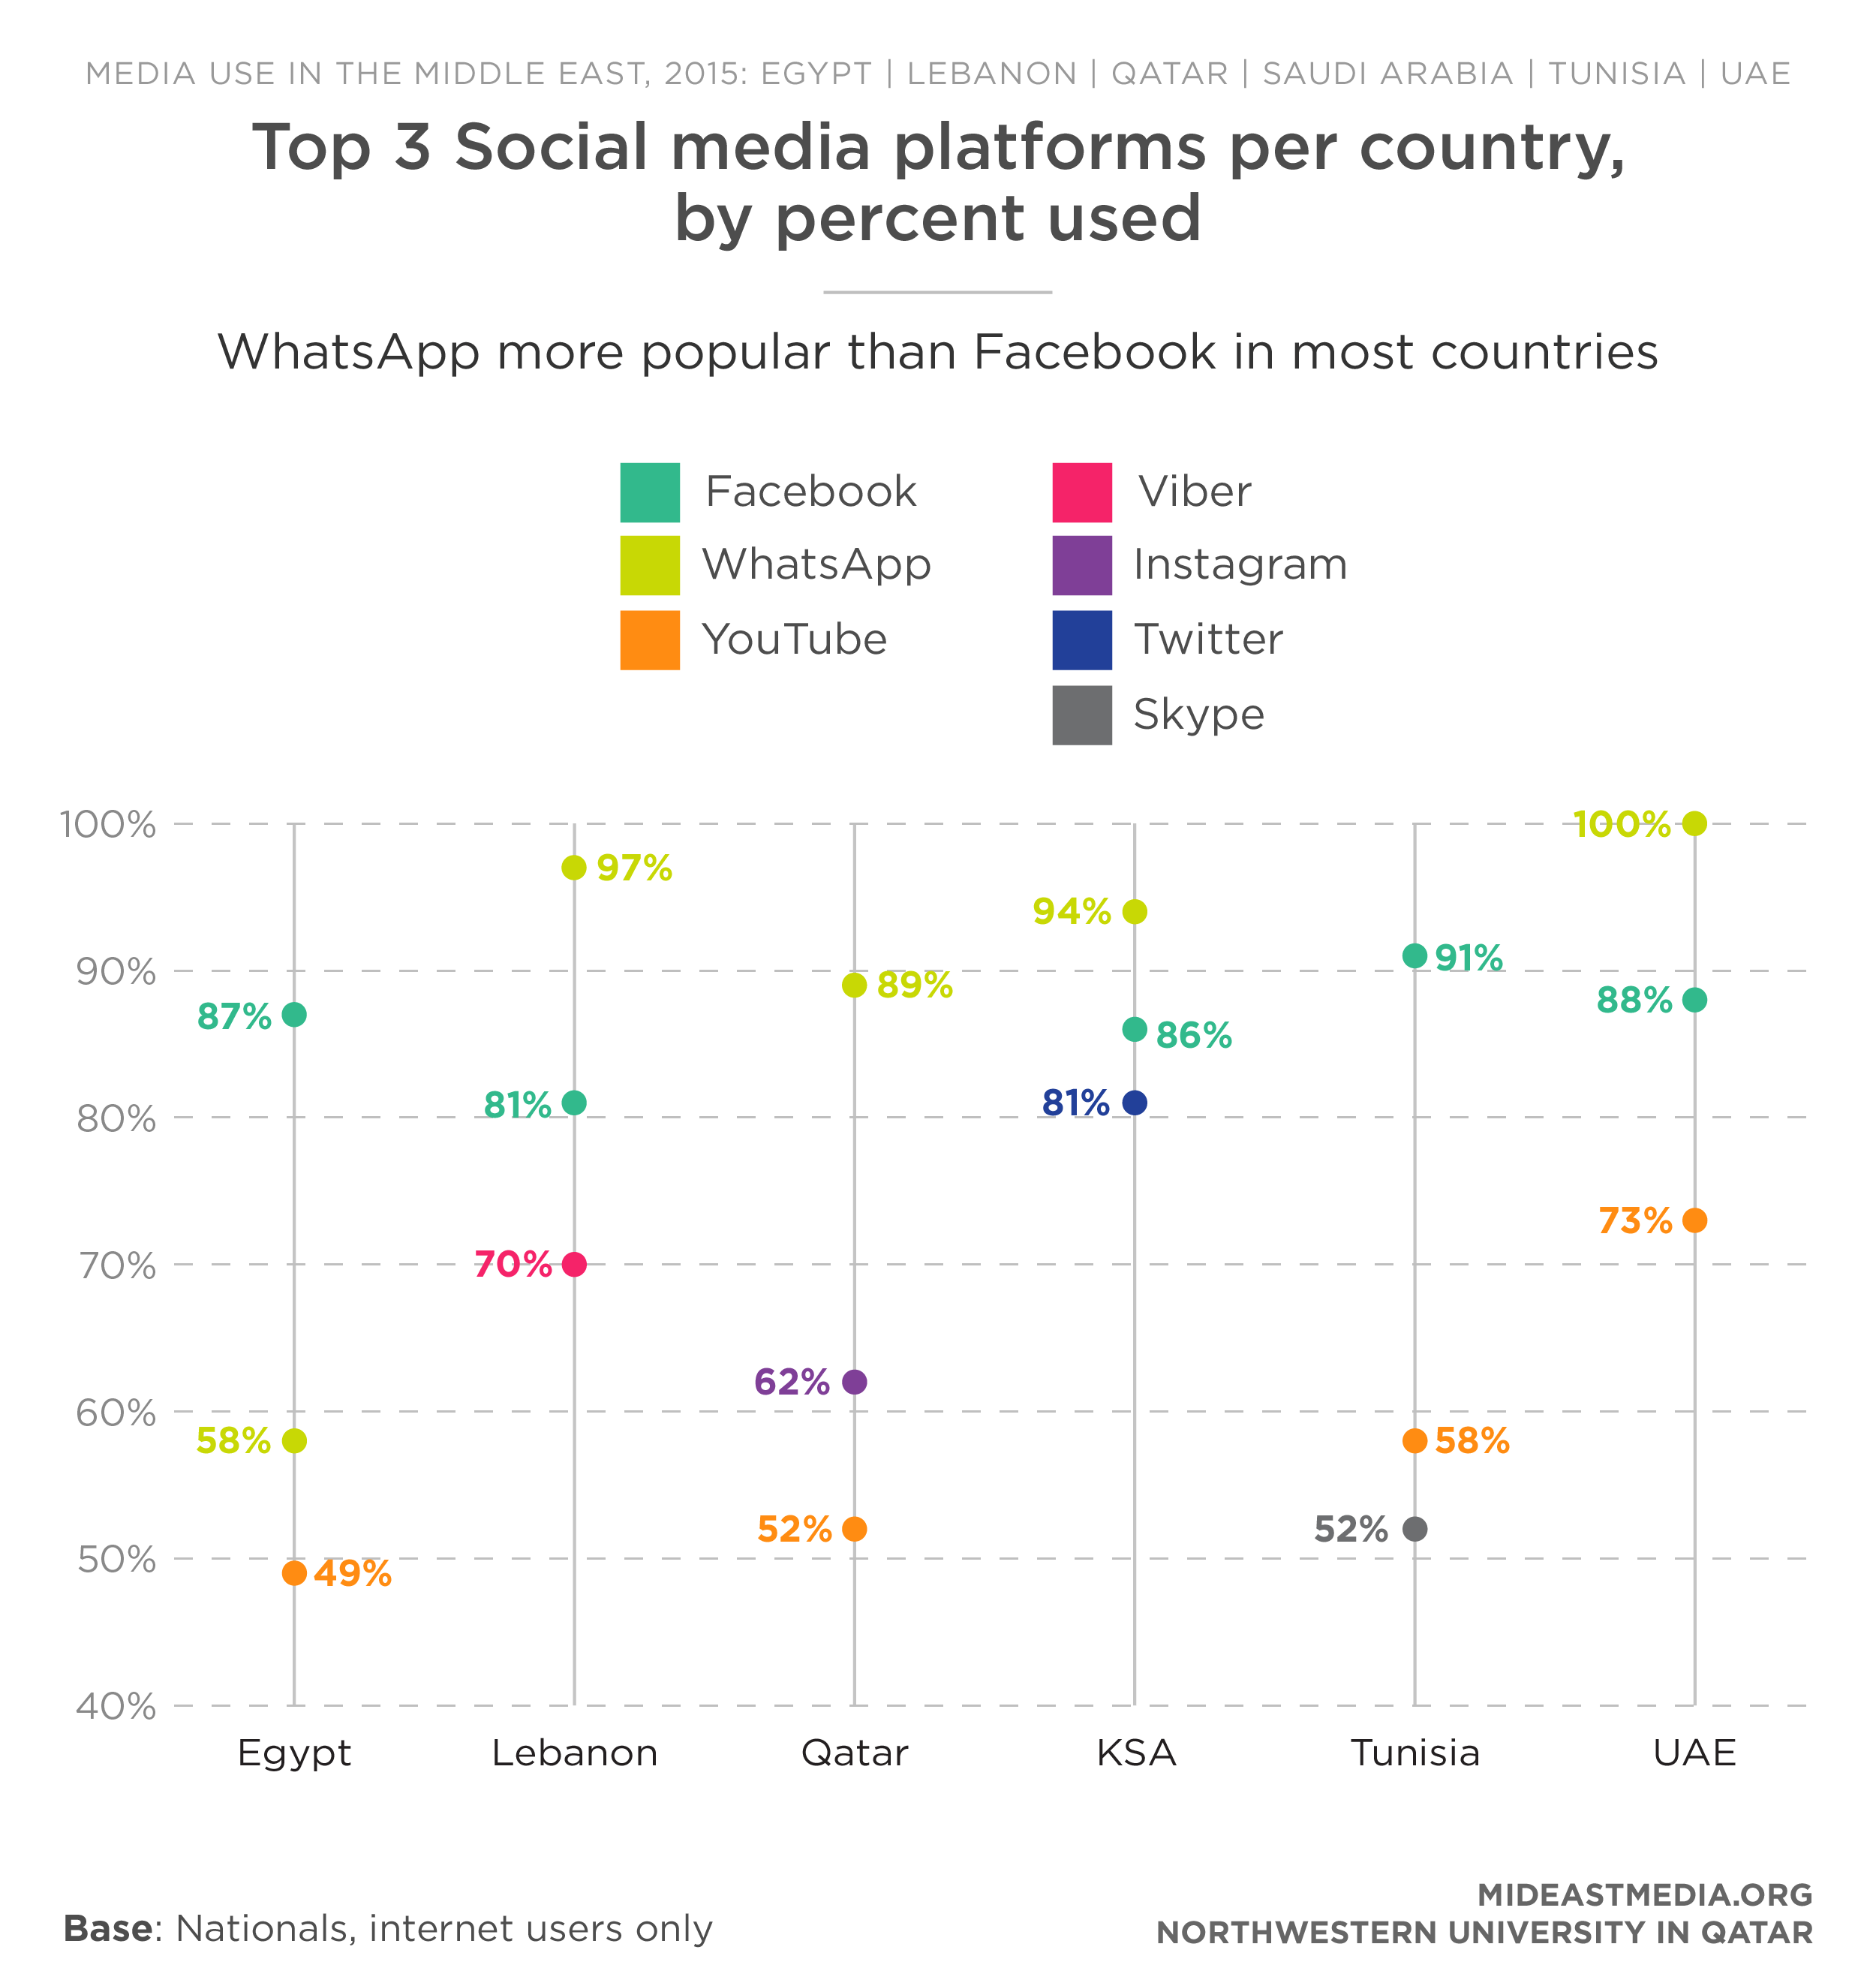
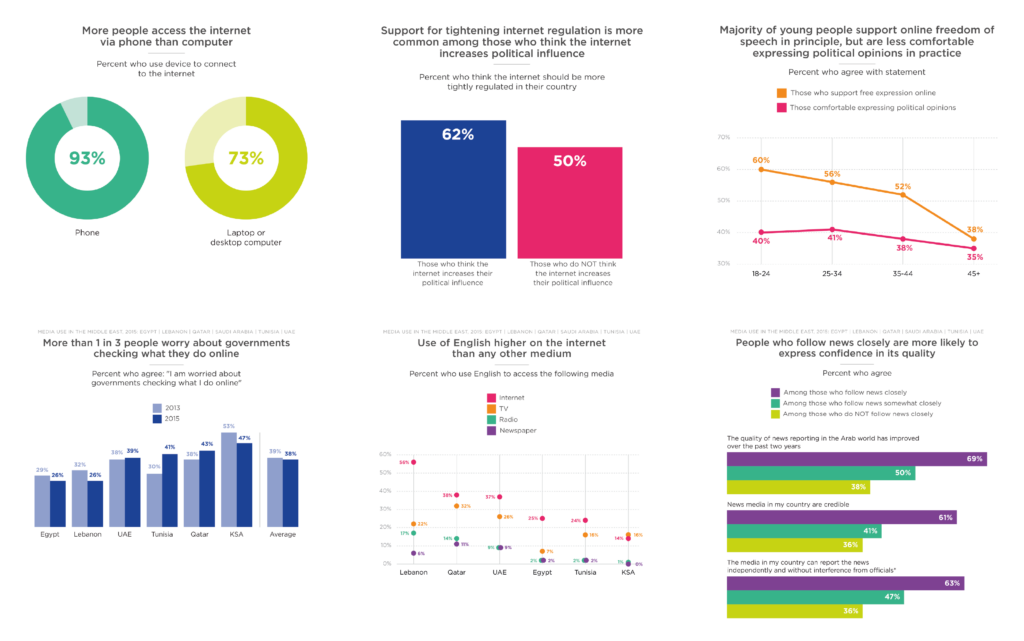
MICROCONTENT
To increase the reach of the website and interactive tool, we wanted to create content that enabled users to understand and share findings from the survey. Microcontent is the practice of creating and distributing timely branded graphics that tell a single story. We worked with Northwestern University to “cherry-pick” some of the survey’s best findings to create these shareable pieces of visual content. We’re seeing great usage from the microcontent via social media, as well as third-party publishers like PBS.
Thanks for taking the time to read through the project details. If you have any questions about the project, we’d love to talk with you.
 View Work