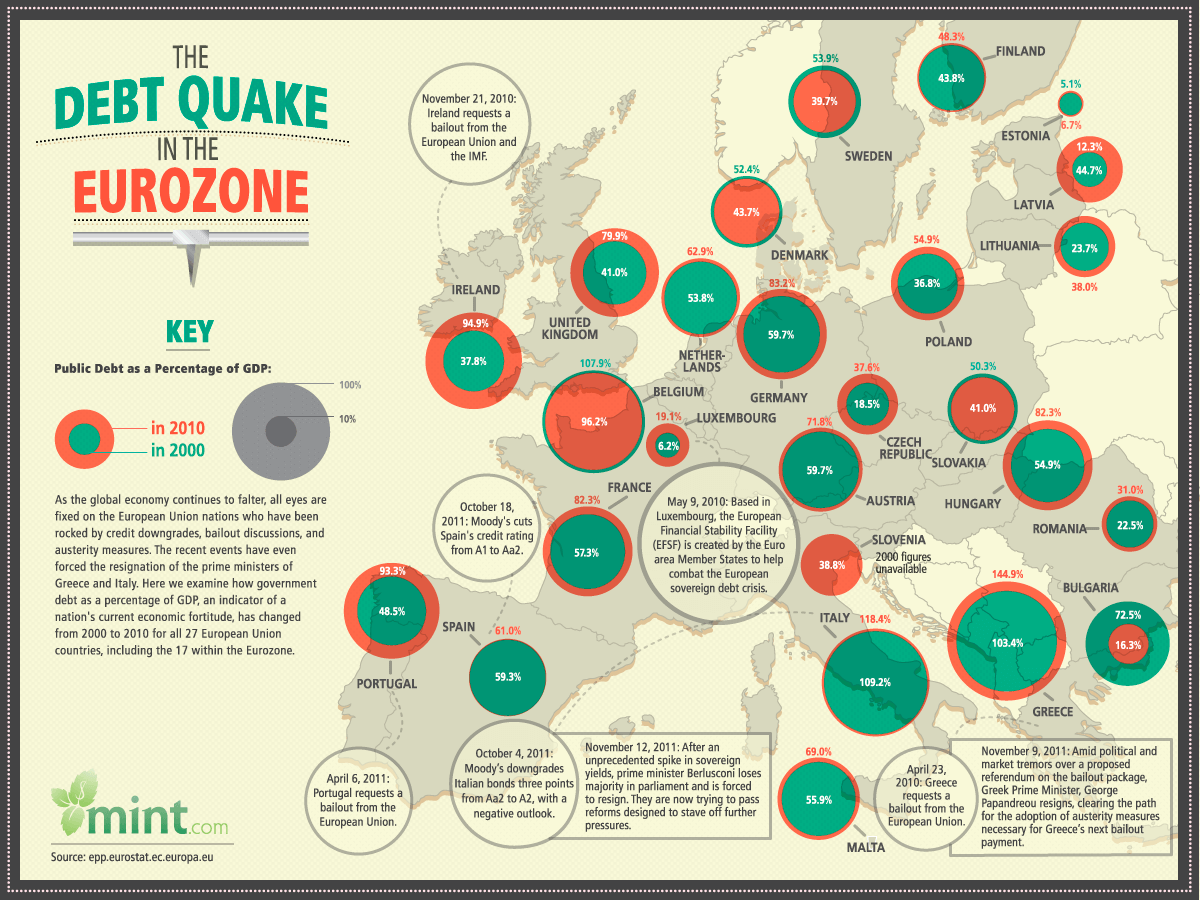
As the global economy continues to falter, all eyes are fixed on the European Union nations who have been rocked by credit downgrades, bailout discussions, and austerity measures. We created this infographic with Mint to examine how government debt as a percentage of GDP has changed from 2000 to 2010 for all 27 European Union countries, including the 17 within the Eurozone.