
We’ve talked at length about why your annual report is such an important piece of content for your brand. It doesn’t just satisfy a legal requirement; it’s a bold statement about who you are, what you do, and how you are succeeding. The stronger your annual report, the more you can increase your visibility and connect with the community who supports you.
Of course, we know crafting an annual report can feel intimidating or taxing. That’s why we’re giving you a step-by-step guide to help you create an engaging report.

How to Create a Great Annual Report
The key to a great annual report is to turn the information you’re including into an interesting story, using every storytelling tool at your disposal. From copywriting to design, the tips you’ll find here will help you bring your annual report to life on every page.
1) Choose the right format.
Annual reports have evolved over the years (and in the best ways). Whereas they used to be dry, dull print reports, there are all sorts of exciting and engaging ways to tell your brand story, whether it’s on paper or on a screen.
How do you know what format is right for you? The whole point of an annual report is to showcase your brand’s achievements in a meaningful way, so the format you choose will probably be influenced by your audience and your brand’s product, service, or mission. If you’re not sure how to decide, here’s a simple rundown of your options.
Print
The good old standby, print annual reports are the most user-friendly format. They are usually simple and straight forward, but they can be just as exciting as other formats, depending on your presentation.
Example: The Sonae 2012 Annual Report by Ivity Brand Corp. featured colorful gears that readers could manually turn.

Digital
If you’re not limited by page count or printing costs, digital can give you more opportunities to be creative. Also, because digital content is so easy to share, it is the easiest way to get more people to engage with your content.
Even if you’re just posting a PDF slideshow to your website, think of ways to promote your report online. An interesting data visualization, pull quote, or statistic can be great visual content for social platforms.
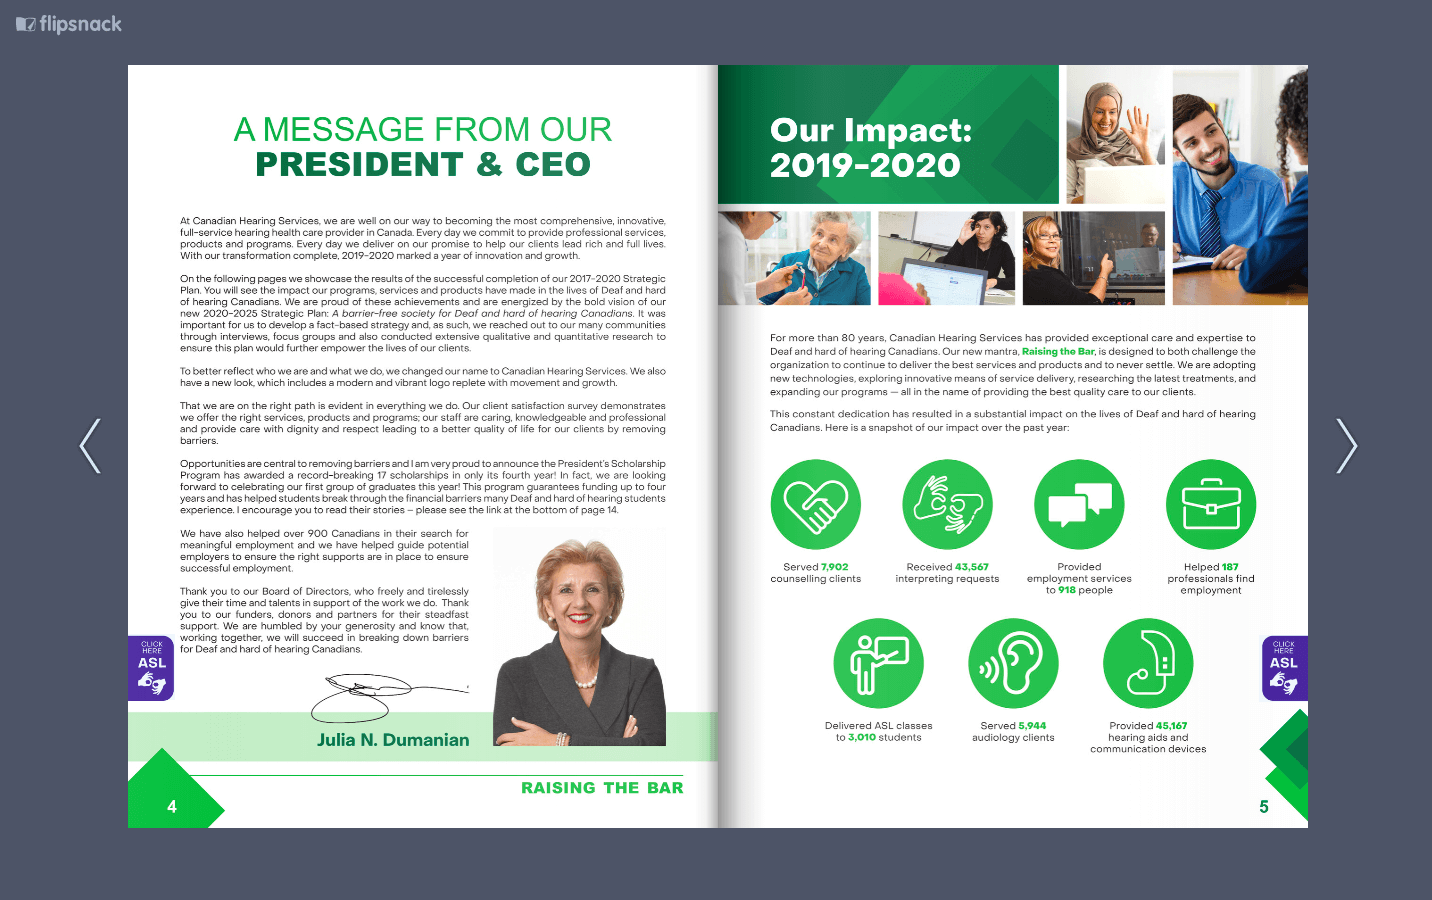
Example: Canadian Hearing Services includes a click-through slideshow of their print report on their site, making the content easy to consume.
Example: Goodwill of Southern California shares a simple stat about their achievements—a great way to promote their mission on social media.
View this post on Instagram
Interactive
Interactive content is a great way to encourage people to engage with your content. Whether you create a structured interactive that guides them through the story, or an exploratory experience that they can poke around on their own, the more time they spend in your content, the more invested they’ll become. Interactive annual reports are especially effective if you have large data sets to explore.
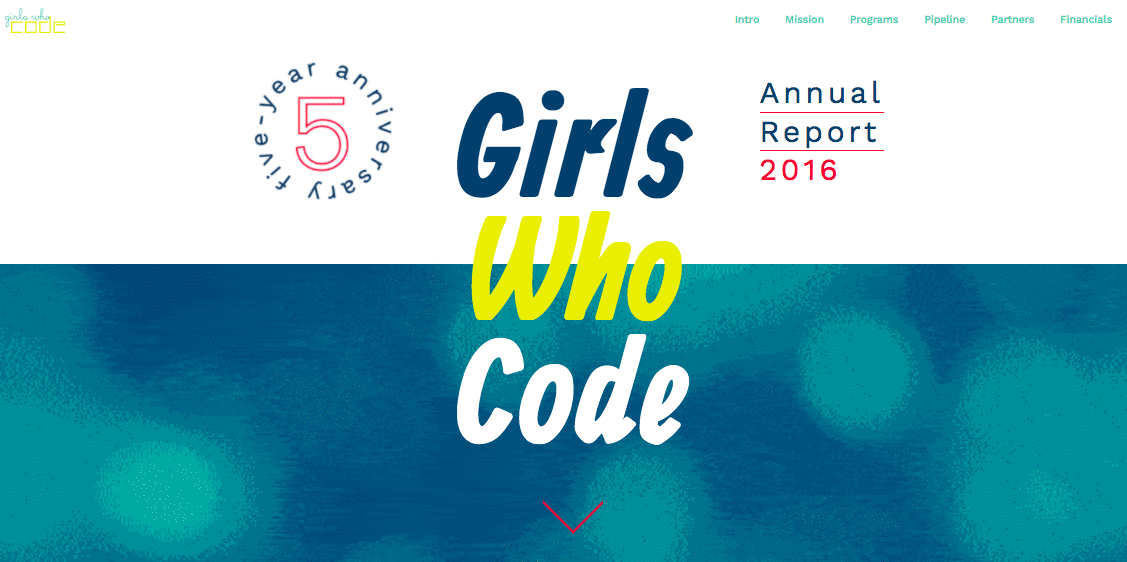
Example: Girls Who Code is a nonprofit that teaches teens girls to code. Since their work is all about professional computer programming, a slick interactive annual report was the perfect way to showcase the value of what they do.
Video
People are busy, so offering them quick and succinct information is much appreciated. Video is a great way to deliver your annual report highlights in a short amount of time. It’s also a great way to humanize your brand and let people tell your story.
Example: Juvenile Welfare Board’s video annual report lets families strengthened by JWB’s services share their stories.
Tip: If you really want to make an impression, brainstorm alternate presentations. When it comes to format, you can be as creative as you want to be.
Example: Try something novel like the Banques Alimentaires Québec 2012-2013 Annual Report by LG2 Boutique, which came wrapped around a paint can.

Example: The Well Done 2006 Annual Report by Bruketa & Žinić required readers to bake—yes, bake—a booklet to see images appear inside.

No matter what story you’re telling, make sure that you have the resources and knowledge to produce whatever content format you choose—before you dive into the writing process.
2) Craft a narrative.
It’s a shame when brands just compile their numbers, add a letter from the president, and call it a day. There is a lot of valuable content to be shared in an annual report, but if it isn’t presented appropriately, much of it goes to waste. As a cornerstone piece of content, your annual report should effectively communicate your brand story.
Anchor your annual report around a core narrative. Is there a theme that influenced your work throughout the year? Was there a successful initiative that encapsulates your message? Did your work affect change in a significant way?
Crafting your report with a meaningful through line makes it easier to digest what’s in the report and lets you showcase your brand in its best light. (This core story should also influence your design.)
Tip: Sometimes your strongest story will come from the numbers in your spreadsheets. Follow these 5 steps to find compelling stories in your data.
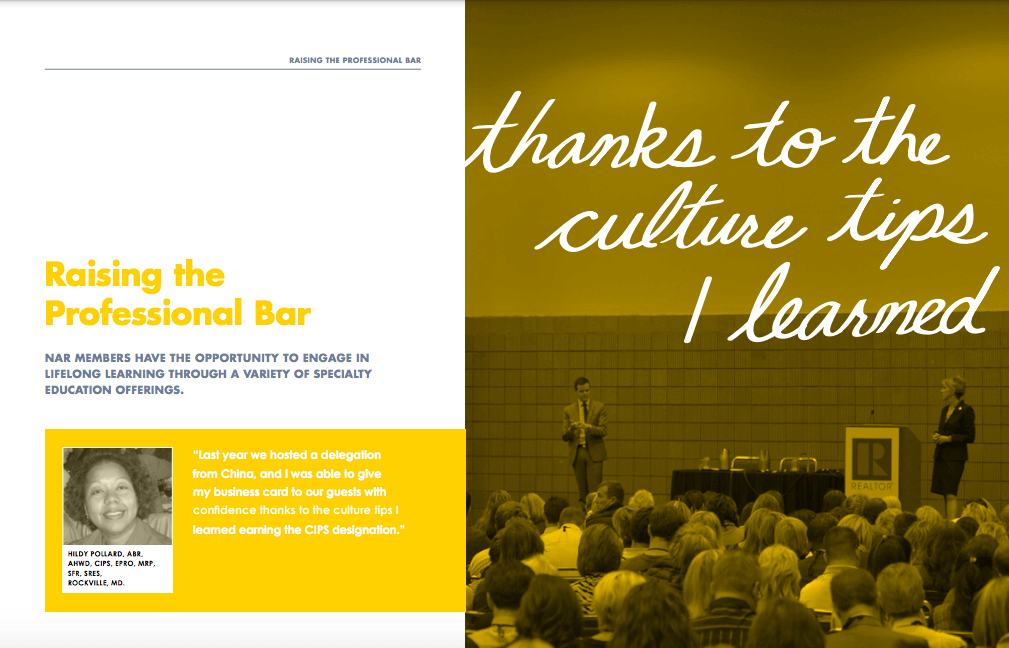
Example: The National Association of Realtors 2014 Annual Report was crafted around the theme “You are NAR” to reenforce how important each member is.
3) Demonstrate your impact.
An annual report is an opportunity to highlight your accomplishments, build trust in your organization, and show your stakeholders your success.
But to really make an impression and help your viewer emotionally invest in your brand, you need to highlight the impact of these accomplishments. How does your work affect individuals, businesses, communities, or even the world?
Tip: Instead of just listing a timeline of highlights from the year, use data, testimonials, quotes, individual stories, or other information to provide context and show the real impact of your efforts.
Example: We collaborated with Goodwill of Orange County to create an annual report that told the story of “The Good Effect,” how the things they do help their larger community and have a lasting effect.

4) Humanize your work.
People want transparency from brands. This applies to your financials, of course, but it also means that people want to know who you really are as a brand. Who works for you? Who do you work with? How do you interact with the world? The more you let people behind the curtain to see these things, the more likely they are to trust you.
As you craft your annual report, look for opportunities to humanize your brand in every way. Write in your brand voice to show off your personality. Use images of people, whether it’s your employees or customers. Include interesting or entertaining anecdotes that showcase who you are. This is one of the best ways to turn a dull report into a lively piece of content.
Tip: See our guide to culture marketing for more ideas to incorporate your company culture into your brand storytelling.
Example: For the Krochet Kids intl. annual report, we put the stories of the women they work with front and center.
5) Visualize the numbers.
We’re huge proponents of data visualization because it is both aesthetically pleasing and an effective form of visual communication. (Fun fact: Our brains are pre-wired for visual communication, so visualizing data makes the information presented easier to comprehend and recall.)
Of course, presenting data effectively is crucial, so make sure you’re following data design best practices. And if there is particularly pertinent information that supports your story, include callouts or additional context to ensure your reader understands the data’s significance.
Tip: See our data visualization 101 guide for more info on how to design common charts and graphs, and try these 25 tips to improve your data visualizations.
Example: The 2020 EggTrack Interactive Report is an annual report that showcases the progress 100+ companies have made toward using 100% cage-free eggs by 2026. The report features a wealth of data that viewers can explore to see each company’s individual progress.

6) Follow design best practices.
The visuals you include tell your story as much as the words on the page. Your choice of illustrations, photos, colors, and fonts will all affect the viewer’s interpretation of the information.
As you move forward with design, think about how you can use every design element to enhance the experience. Depending on your core narrative, you may want to choose a particular visual theme or metaphor that relates to your story. It may also be influenced by the format you choose.
This is an opportunity to get as creative as you like. However, make sure your annual report design reflects your visual identity.
Tip: To design your report effectively, avoid the most common design mistakes, and follow our tips to keep your report on brand.
Example: We designed the Pacific Life 2015 Annual Report around an aquatic theme. It helped present the brand as a living, breathing, energetic entity to remind the reader that Pacific Life is more than a life insurance company.

7) Surprise your readers.
If you challenge yourself, you can really break the mold with your annual report. This extra layer upgrades your readers’ experience, making your annual report truly memorable. Some ways to do that…
- Share a delightful photo, story, or tidbit. Warby Parker’s 2013 annual report mentioned the time their team ordered so many sides of bacon from Seamless that the service was sure there’d been a mistake.
- Include a fun little freebie. Flywheel’s 2015 Year in Review showcased the CEO getting a tattoo of the company’s logo. In honor of the event, they made custom temporary tattoos to send to anyone who requested them.
No matter your budget, you can always come up with something creative. Remember: Your annual report is a huge opportunity to make a bold statement—don’t waste it.
Tip: If you need a little more inspiration, take a look at these 50 examples of truly inspiring annual report design.
Look For More Ways to Tell Your Brand Story
Whether it’s an infographic on social media or an e-book on your website, every piece of content you create is an opportunity to tell a consistent, cohesive brand story that grabs attention and turns people into lifelong customers. If you’re looking for more ways to upgrade your content game…
- Find out what 5 ingredients you need to tell a strong brand story.
- Try these 7 tips to tell your brand story in different ways.
- Mix up your designs by experimenting with these different storytelling formats.
And if you need a little help bringing your story to life, we’d love to chat.


Let's upgrade your marketing game
Get fresh tips, how-tos, and expert marketing advice every week. (15,000 people already are.)