
Any time your brand creates content, what you are really trying to create is a connection with people. When you can tell brand stories that resonate—and do so reliably and consistently—you can build better, stronger relationship with people and create a community that supports your brand long term. But coming up with stories that do connect isn’t the easiest task, especially if you’ve been content marketing for a while. We know how quickly the well can run dry. We also know you have a secret bank of story ideas you’ve probably never explored, hidden right in your own company data. Turn those insights into strong data storytelling and you’ll win your customers’ hearts and minds—one piece of content at a time.
5 Reasons Why Internal Data Storytelling Is Your Best Friend
Data can be a powerful source of content ideas. But not just any data. Your company data—the stuff living in spreadsheets, hiding out in surveys, and chilling in your client reports—is the real gold. While all types of content marketing can be effective, stories that come from behind your four walls are especially relevant. In an increasingly crowded landscape where you have to fight to stand out, you need content that is special and unique. Data storytelling fills that exact need. Here’s why.
1) It’s original.
We are living in a world of content, yet most of it is rehashed fluff or clickbait. Content that is fresh, unique, and exclusive is a huge competitive advantage. By digging into your own data, you can discover interesting trends or surprising insights that can translate to compelling content that no one else has.
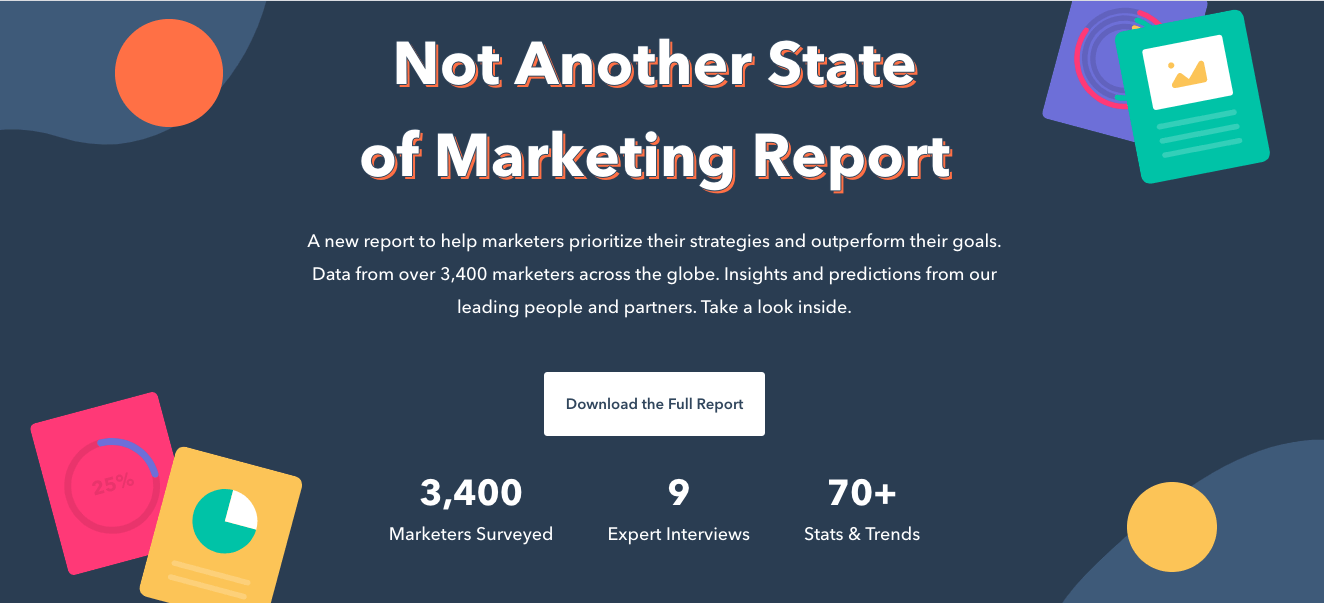
Example: Hubspot surveyed 3,400 marketers on the state of marketing and turned the results into the cheekily titled Not Another State of Marketing Report. This valuable resource helps marketers strategize to achieve their goals—and positions the brand as the go-to expert on the subject.
2) It’s interesting.
You know what the people you’re trying to reach want, what they struggle with, etc. Thus, you know exactly what type of subjects will attract them. Data-based stories are a great way to explore these areas of interest. However, when you use data from outside sources, it is often too broad or too niche. With your own data, you know your stories are particularly relevant to your crowd, whether it’s your customer, colleague, or larger industry.
Example: We partnered with Northwestern University in Qatar to turn their annual Media Use in the Middle East survey into an interactive experience. This put the data in the visitors’ hands and let them explore the areas of the report they were most interested in.

3) It’s credible.
We’ve talked a lot about the value of trust in a brand-consumer dynamic. When it comes to the source of your data, it must be credible. When you use outside data, you can’t always guarantee that the data is accurate.
While reputable sources certainly exist (see our roundup of 100+ data sources), there’s nothing better than something that comes from your own research.
Example: We helped HighFive turn insights from their Workplace Culture and Communication report into a simple, shareable infographic. This helped highlight the findings in an easy-to-digest format while promoting the report itself.

4) It’s newsworthy.
Your own internal data provides unique, credible insights that can establish your brand as a thought leader not just among your customers but among your industry.
Remember that the information extracted from your data is often indicative of larger industry trends. You may uncover unexpected findings that bust a widely held myth or reveal something entirely new. Either way, these are newsworthy discoveries that elevate your status and, if picked up by media, can help you expand your reach.
Example: LinkedIn uses its company data to create a monthly Workforce report. With millions of users, they have a rich source of data to explore and share with the general public. Thus, the report has become a go-to source for publications that cover employment and the economy. (See how we helped LinkedIn create 101 graphics in 24 hours, and find out how to create content that publishers fall in love with.)

5) It establishes trust.
By revealing your insights, you are welcoming the world into your organization. It shows that you know what you’re talking about. It also shows you have nothing to hide and, in fact, are eager to share your knowledge with others. This fosters tremendous trust both in your customer and in your employees.
Example: Your company data can be used to tell stories about your industry, your customers, and even your own culture and brand. Zendesk elevates its employer brand by including data about the breakdown of their employee demographics. This is a level of transparency few brands provide, showing just how dedicated they are.

One added bonus!
While data storytelling is great for connecting with people, diving into your data can also improve other areas of your organization—even your bottom line. When it comes to data vs. gut-instinct decision-making, you know what you’d choose. The more you can learn to interpret your data and really “see” what it’s telling you, the better you can make decisions, justify pivots, or support your initiatives.
Don’t let your data go to waste! Download The Content Marketers’ Guide to Data Storytelling to find out how to partner with data analysts, find interesting stories, and turn them into compelling content.

How to Start Finding and Telling Data Stories
Just the words “data storytelling” can feel intimidating to content marketers, but it really doesn’t have to be. We’ve helped plenty of brands turn their data into awesome content, and it’s a pretty simple step-by-step process. Here’s how to get started.
- Find your data. Here are 9 sources of great data you can probably find in your own servers.
- Find the story in your data. Follow our easy guide to examine data relationships and gain insights that can translate into compelling content.
- Craft your narrative. Find out about the keys to an effective narrative, and follow these tips to make sure that story reflects your brand.
- Choose the right format. There are so many options to choose from. See our helpful rundown to figure out which format is best for your story.
- Design your data according to best practices. Design is a crucial element to get right if you want your story to really resonate. For a data visualization refresher, find out how to design the most common charts and graphs, and follow these 25 tips to improve your data design.
- Send it out into the world. For tips to make sure your content reaches the most people, download our free e-book The Ultimate Guide to Content Distribution.
Most importantly, look for more opportunities to use data storytelling to communicate better. From presentations to annual reports, there are plenty of ways to bring your brand to life through data.
If you need anyone to help out, consider bringing in some expert help. Follow our tips to find a good data visualization agency (plus tips to work together once you find the right one.) And we’re always sharing our latest tips and insights, so feel free to bookmark us. If you still have more questions, we’re always down to chat, too.

Let's upgrade your marketing game
Get fresh tips, how-tos, and expert marketing advice every week. (15,000 people already are.)