Great data storytelling languishing in blogs, a beautiful chart hiding on a designer’s desktop, a great graph shared once in an infographic—these are some of our biggest pet peeves, because a great data visualization should never go to waste. It takes a lot of time and skill to produce beautiful data visualizations, and we think you should get the most mileage out of anything you put that much energy into.
10 Ways to Reuse a Data Visualization
That’s why we encourage you to republish, repurpose, remix, and reuse your data visualizations as much as possible. (We actually call this a divisible content strategy, which you can read more about here.) We know that it’s easy to wrap up a project and move on, but you should really look at all content you create through two lenses:
- How you’ll use it in its first iteration
- How to use it to extend the shelf-life of the content or support other collateral you’re creating
For data visualizations in particular, there are a lot of things you can do to extend their reach. Here are some of our favorites.
1) Infographics
Now, for many people, the whole reason you end up with a slick data visualization is because of an infographic. But if you’re starting with a visualization from, say, your annual report, you may be able to find a new home—and even a new story—in an infographic. Additionally, you may have a series of infographics on similar subjects. As long as it’s relevant, save your designers some work and repurpose the visualizations you have.
Example: We helped Highfive turn data from a company report into a visual, shareable infographic.

If you want to make an effective infographic, check out our best tips from creating more than 4,000 of them.
2) E-books and White Papers
No matter what you make, visuals will always enhance it. (To see the power of visualization in action, check out this video.) And when you have a great data visualization, it’s because you have great data (well, we hope). For things like e-books and white papers, data is a great way to tell your story and break up the information with engaging visuals.
Example: We worked with HP to create their highly visual Enterprise 2020 e-book, featuring plenty of data visualizations.
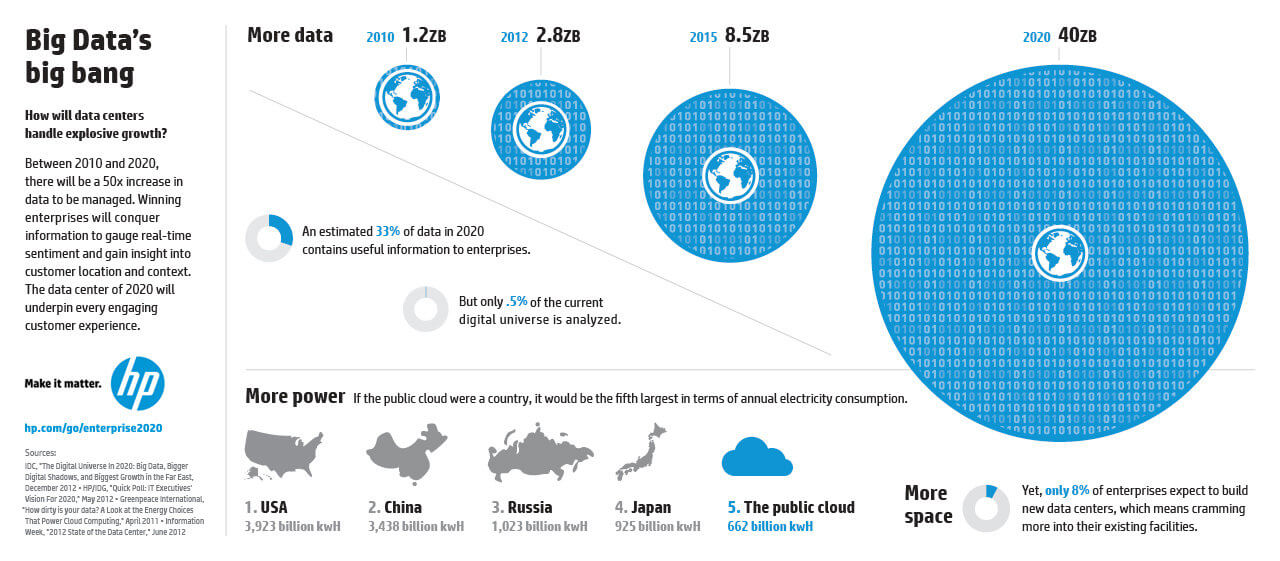
For more tips on how to make better content marketing, check out our e-book archive.
3) Reports
Whether it’s a client report, company report, or annual report, a great data visualization makes it a lot easier to “see” the significance of numbers. When you need to communicate or support your argument, data visualization is very useful. (Also, who wouldn’t prefer a well-designed piece in their inbox over a droll spreadsheet?)
Example: We partnered with the NFL to produce print reports featuring data and analytics for each team’s web performance. Each report contained detailed information, presented in a visually engaging way for easy reference.
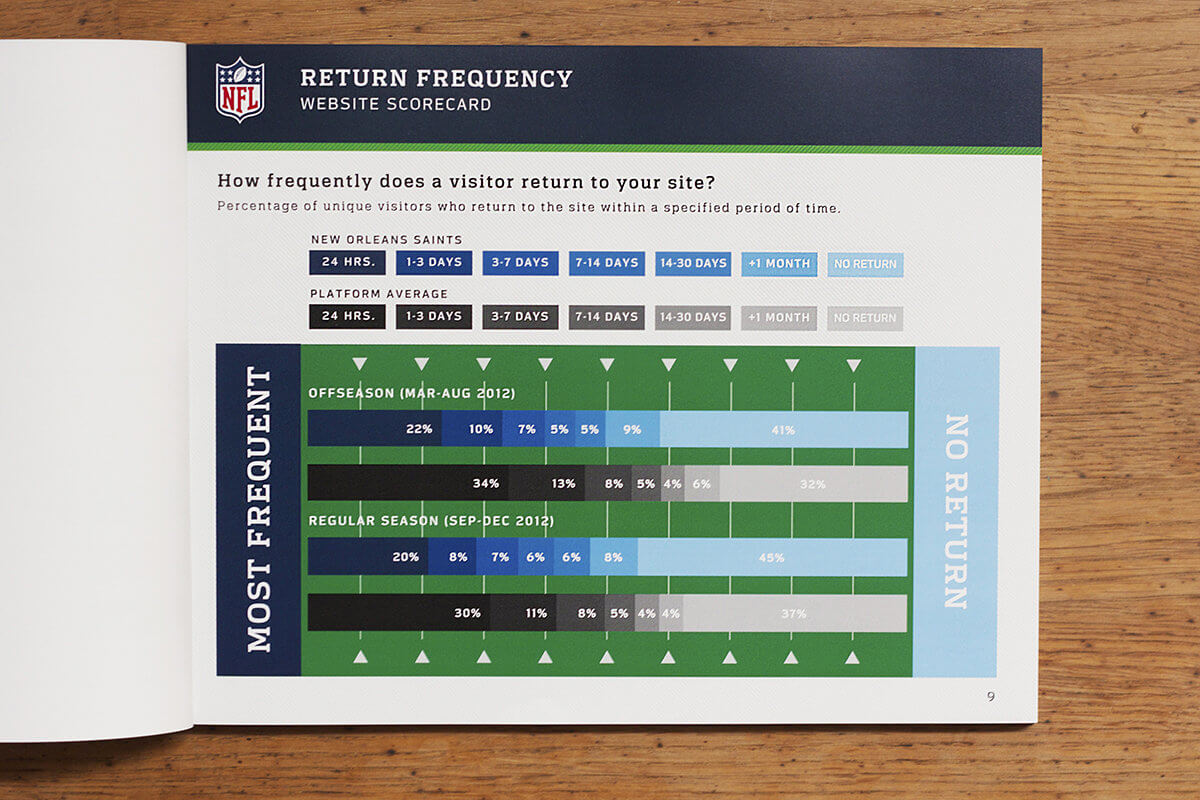
And check out how we turned the Krochet Kids intl. annual report into an interactive data visualization.
4) Presentations and Tradeshows
When you are publicly presenting information, you need it to be visually impactful. Whether you’re trying to engage an audience at a talk or grab the attention of someone passing by your booth at a tradeshow, a beautiful visual always helps. This is especially true for any environment where audio may be ineffective, like on a loud and busy tradeshow floor.
Example: We partnered with the Gates Foundation to design a highly visual presentation, using data visualizations to make the information easier to synthesize.
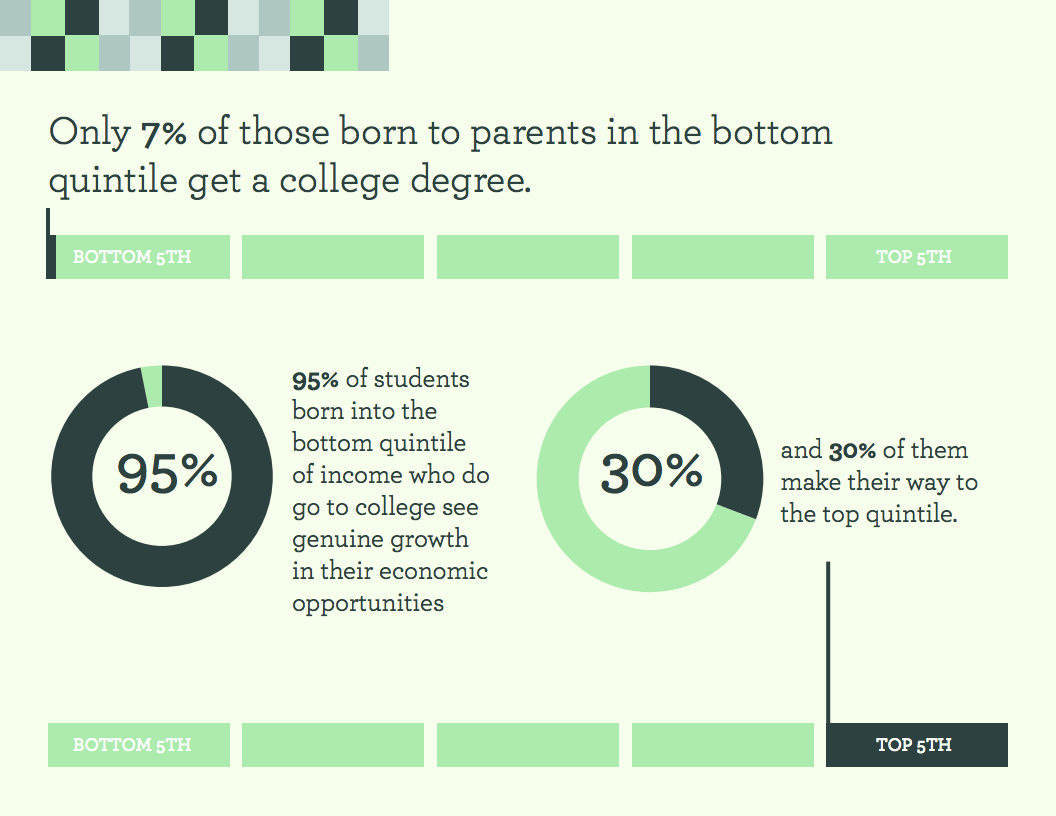
If you want to add a data visualization to your presentation, make sure to follow our 10 tips for presentation design.
5) Interactive Infographics
Interactive content is a great way to bring people into a story, to immerse and engage them. If you really want your data visualizations to come to life, interactives can do it. You may decide to incorporate a data visualization into an interactive slideshow or make the actual visualization interactive. There are plenty of options, depending on what you need.
Example: We worked with Microsoft to create their Anatomy of a Breach interactive website, which includes animated data visualizations that show how prevalent the crime is. (Go behind-the-scenes of the project here.)
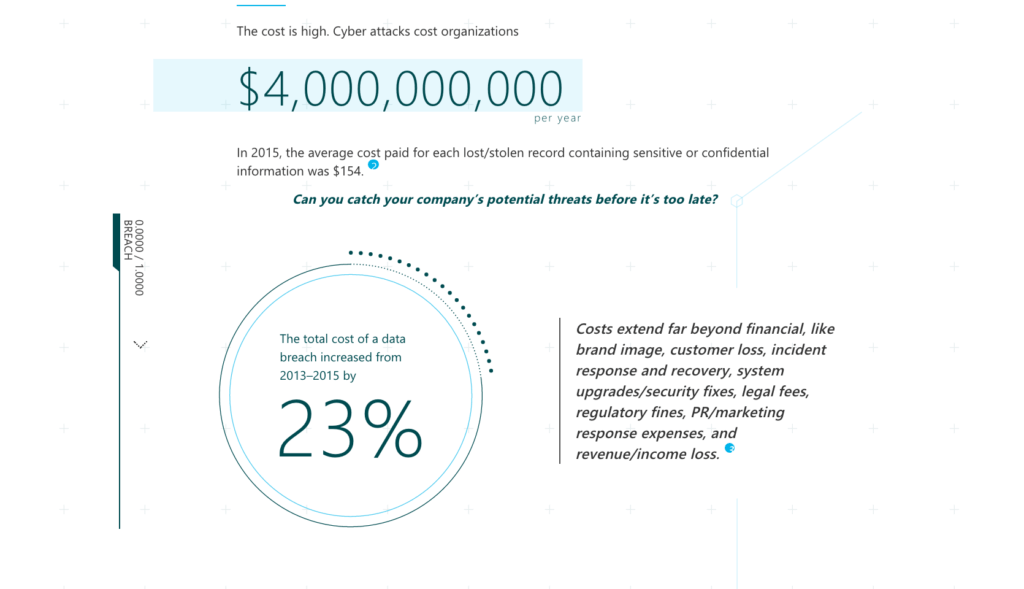
For more inspiration, check out 101 awesome examples of interactive infographics.
6) GIFS AND ANIMATED VISUALIZATIONS
Animated data visualizations differ from interactive infographics because they don’t actually require interaction; they can move on their own. Because they’re visually stimulating and stand out, they are an awesome way to catch someone’s eye in a social feed or spruce up an old blog post.
Example: We partnered with Takepart to create a set of GIFS that highlights facts important statistics about veterans to address mental health support for veterans. Though simple, the animated data visualizations make a powerful statement.

Learn more about why motion content is so effective.
7) Motion Graphics and Videos
If you haven’t noticed, we’re big proponents of motion in all its forms, both in animation and interactivity. Video is a natural extension of that. It may be an animated motion graphic or a live-action video, but both also provide opportunities to infuse your story with data.
Example: We partnered with Foodbeast and Totino’s to help tell a data story about Americans’ binge-watching habits. Using the actual Totino’s product as a visual challenged us to come up with creative data visualization.
Video is only becoming more popular. Learn more about the differences between motion graphics and video.
8) Microcontent
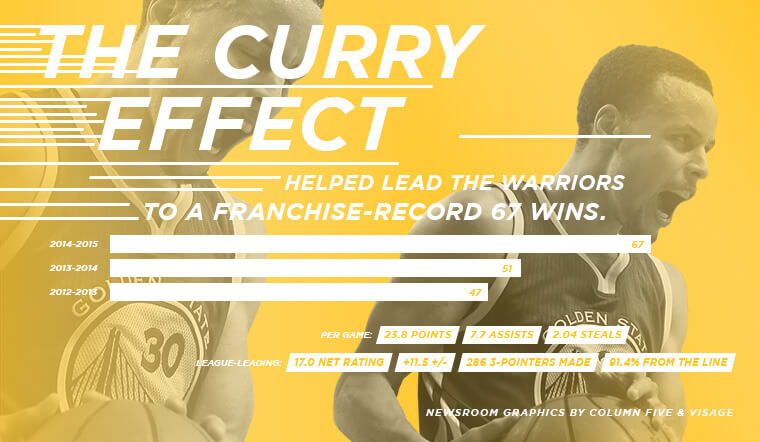
Microcontent is a huge part of a divisible content strategy. What is it? It’s basically all the little visual stuff you use to promote things: the blog teasers, social content, one-off graphics. Data visualizations make perfect microcontent, especially on social. Say you have an infographic featuring 5 different charts. Extract each chart, post it as a visual tweet, and you have 5 different posts promoting a piece of content—each from a different angle. This is one of our favorite ways to both promote and extend the shelflife of pieces of content.
Example: We collaborated with the Golden State Warriors Warriors to create a piece of data visualization microcontent to celebrate Stephen Curry’s MVP award.
For more about how to use microcontent effectively, check out our e-book.
9) Press Releases
Gone are the days of the old-school page-long press release. Journalists, publications, and the public want to know the core message as quickly as possible. This is especially true for journalists who are looking for interesting content to cover. A visual press release that features compelling data—along with a beautiful visualization—is much more likely to get you noticed (and published!).
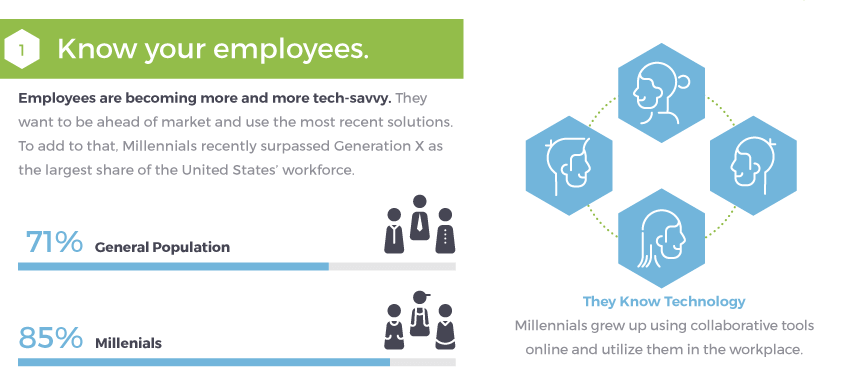
Example: A single panel extracted from our modularly designed infographic for Jive Software is a great visual to entice a publisher to follow a story or envision the content on their site.
Find out more about how to get publishers to fall in love with your content.
10) Misc. Collateral
Every organization has different communication needs that vary department by department. There are many types of collateral that can get a nice upgrade with data visualization. Think of the regular collateral you have (or stuff you’d love to have) that could benefit, including sales brochures, employee materials, etc.
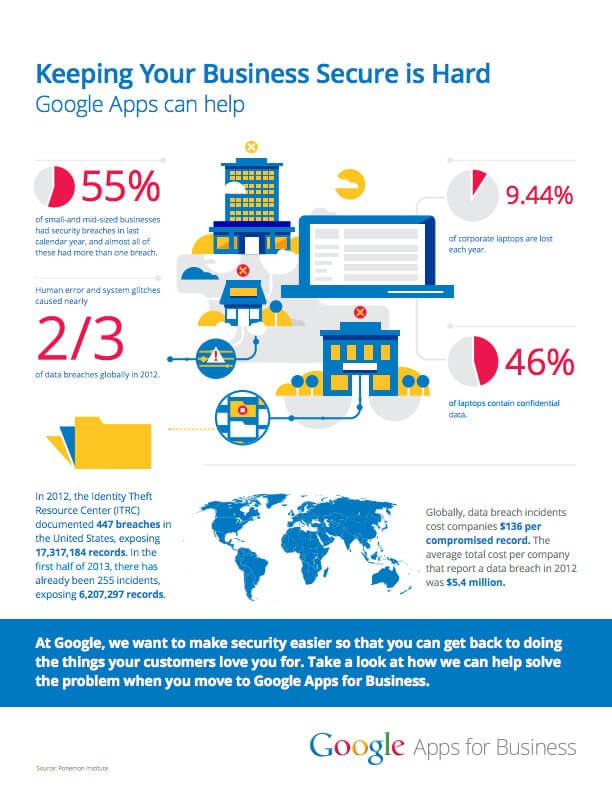
Example: Google asked us to help bring their Trust/SMB Whitepaper to life. So we created a data-rich, print-ready brochure used to promote Google Apps.
No matter what you choose to create, make sure you avoid these 8 design mistakes in visual content.
Of course, remember that before you can create a great data visualization, you need a great data story. Here are 9 sources of data to check out, plus 5 ways to find a great story in whatever you find. Oh, and make sure you always follow data visualization best practices. Check out this guide to designing the most common charts and graphs, and try these 25 tips to upgrade your data visualizations.
Still need help? We’d be happy to talk it out.

