Content alone can’t make a truly great infographic; you need great infographic design. The best infographics make a visual statement, combining the best of design and data visualization to deliver a strong story. But sometimes designers get a little excited and over-design (usually with the excuse of “making the most” of the space), overshadowing the story and creating a dense visual jungle for the reader to find their way through. Let’s all take a vow to end that epidemic right now. Sometimes the best stories can be told through simple, tasteful design—no chart junk, no visual clutter. To show you what that looks like, we’ve compiled some of our favorite examples of infographics that take a minimal approach for maximum effect.

10 Examples of Infographics with Simple Design
If you’re ready to simplify your style, take a look at these beautiful, minimalist designs that put the story front and center.
1) “Holiday Hold-Ups — Travel Delays At The Nation’s Biggest Airports” by Travelocity
This infographic provides useful information to travelers looking to avoid crazy holiday air travel. By breaking down travel traffic by major airport and date, Travelocity helps people better plan their trips. With a beautiful color palette and simple design, this infographic features data visualization at its best. The data is intuitively ordered and color-coded, making it easy for any reader to decipher in an instant.

2) “Cigarette Taxes In Photos” by Intuit
Tactile data visualization is a fantastic technique to bring the data on spreadsheets into the real world. And when you can turn the medium into the message, it’s a slam dunk. This infographic series covers cigarette taxes and cigarette consumption, using actual cigarettes to illustrate the data. It’s simple, visually arresting, and creative data visualization that is far more enticing than a static illustration alone.

3) “Gadgets Galore” by eBay
This is one of our favorite examples of infographics that use simple data visualization effectively. Here, eBay’s infographic on the most desired gadgets depicts the year-over-year popularity of some of the most popular products in tech, broken down by gadget and consumer age. Whereas the design might have been cluttered by over-illustrations of the gadgets and confusing comparisons, this one manages to present all the information in a neat, on-brand visual.

4) “7 Ways to Hack a Drought” by Column Five
Just because a design is simple doesn’t mean it’s relegated to black-and-white line art. This animated infographic design is an eye-catching piece of content that offers easy tips to help people save water. The bright colors and movements bring the story to life, while its modular design makes it easy to extract portions for use in blog posts, social, and other pieces of communication, helping extend the reach of the piece.

5) “Little Bits of Big History” by A&E Television Networks
This mini infographic series features bite-sized snippets of history, which are easy to digest and fun to share. Featuring facts about everything from the planet Jupiter to the moon landing, each graphic includes a brightly colored illustration or visualization. By creating multiple mini infographics instead of one large one, they could seed the content on social, making viewers eager for the next installment.

6) “Inside the DIY Filmmaker’s Toolkit” by Wistia
Even if you don’t have data to visualize, you can still create an infographic design that enhances the content. For this simple infographic depicting the essential tools for filmmaking, simple hand-drawn illustrations add a sense of artistry and capture that work-in-progress feel. For an infographic about DIY filmmaking, this aesthetic captures the infographic theme.

7) “Find and Attract the Best Remote Talent” by Upwork
The best infographic design presents information in a clear hierarchy, includes strong visualization, and follows an intuitive story arc. For this infographic, a modular design, on-brand accent colors, and clean data visualization guide the reader through the info, delivering the story in a simple and straightforward way.

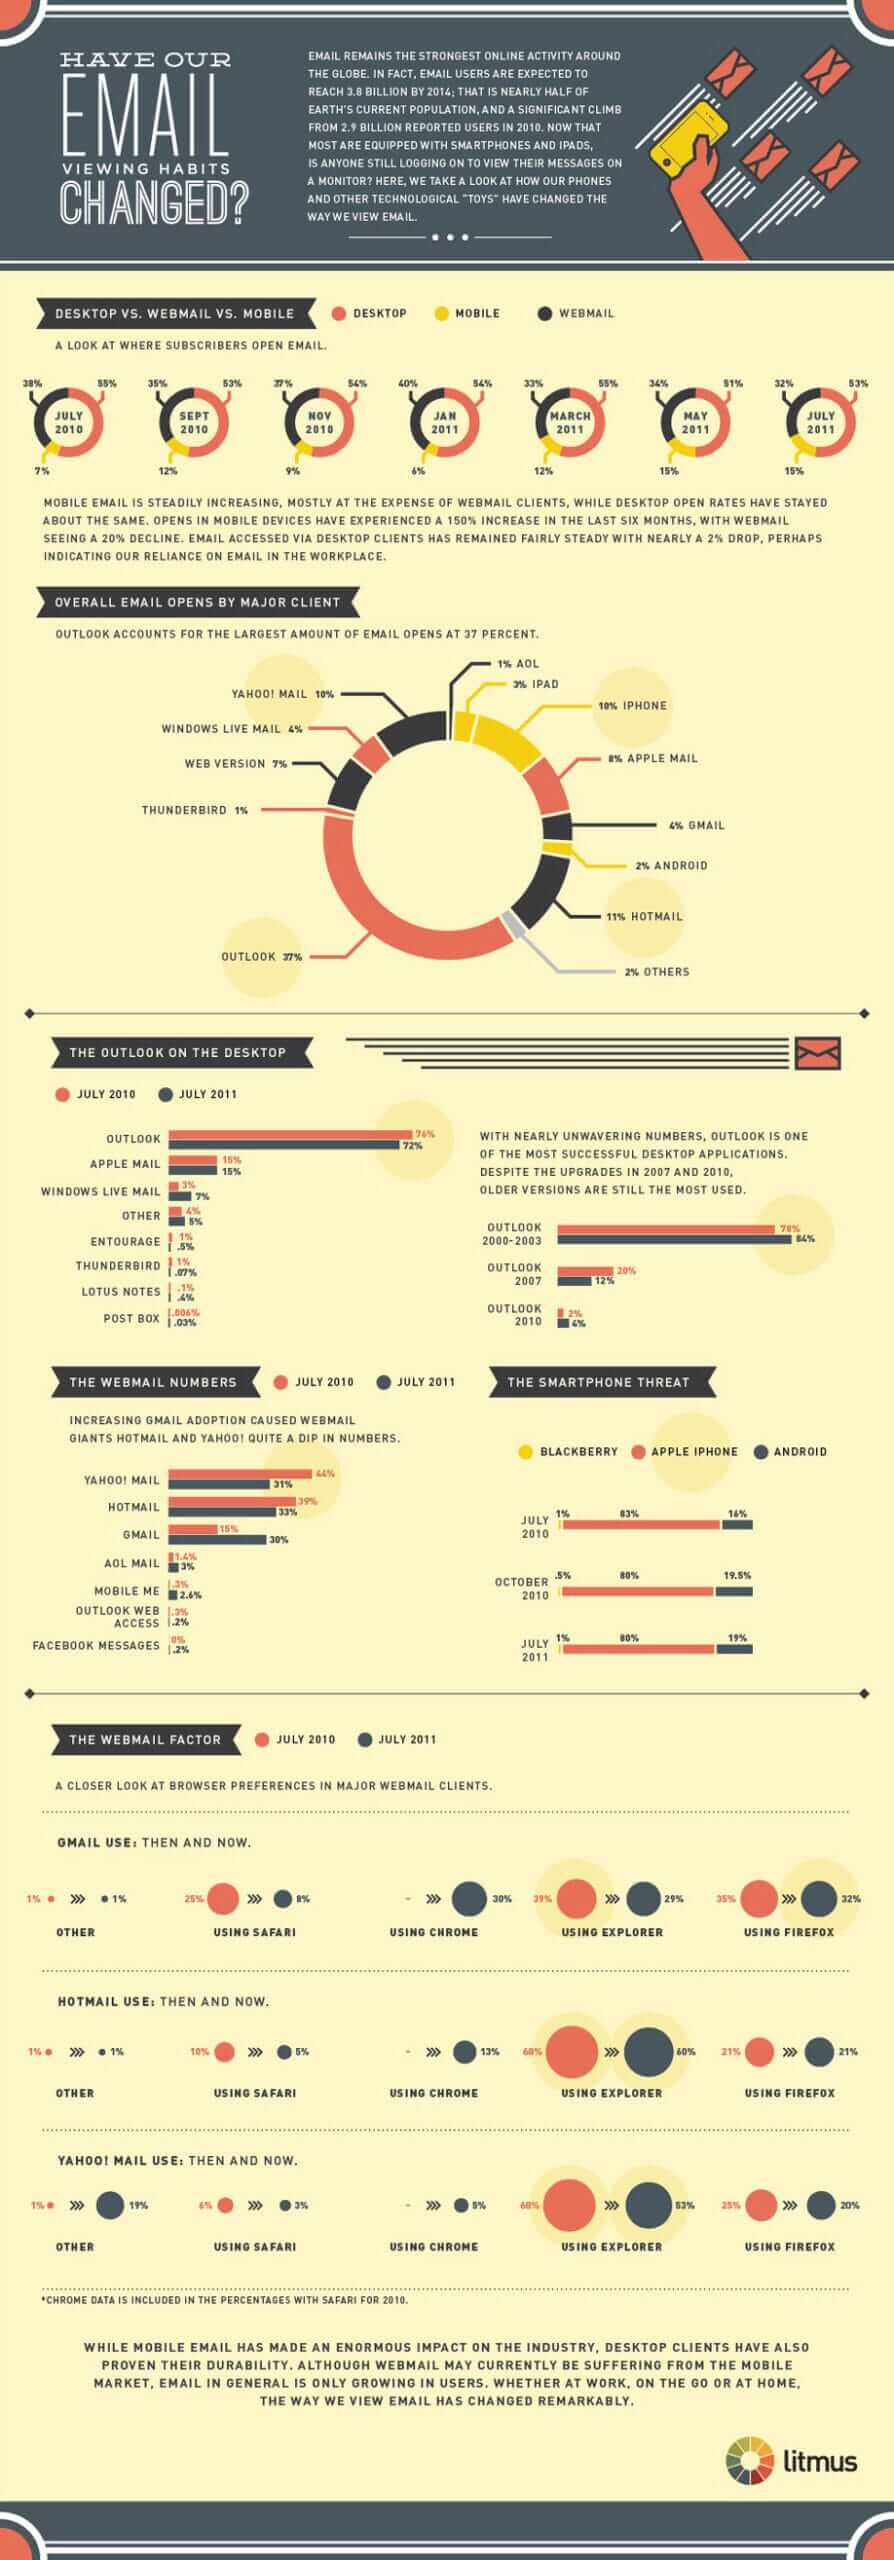
8) “Have Our Email Viewing Habits Changed?” by Litmus
This infographic design is the perfect example of data visualization without chart junk—and story told with minimal visuals. Designers often inject characters or unnecessary illustrations to “color” up an infographic, but the information can be plenty impactful if it’s well visualized, as this infographic shows.
9) “Why Is It So Hard to Quit Smoking?” by GOOD Magazine
Most of us were first introduced to the concept of “infographics” by the little illustrations and diagrams that appeared in our school textbooks. This infographic design brings back that style, giving us a closer look at the biological challenges of quitting smoking. What makes this design work is that the illustrations are thorough but simple—without being elementary—giving it a modern take on that classic textbook feel.

10) “The Almighty Dollar” by GOOD Magazine
Another gem from GOOD, this infographic design uses every design tool to enhance the story. From the green saturation of the stacked bar charts to the simple illustrations of religious centers, it is as artistic as it is analytical—and that is the key to great data visualization.

How to Create Better Infographics
We hate to see bad infographic design thrive, so we’re determined to share anything and everything we learn to help you make better infographics. If you want to stay on top of the latest trends, tips, and best practices, here’s some more stuff to check out:
- Try these 16 ways to come up with great infographic ideas.
- Find out how to fix the 15 most common infographic design mistakes.
- Get our best tips for making great infographics, based on the 4,000 we’ve made.
- Follow our guide to designing the most common charts and graphs.
- Get inspired by these examples of infographics for B2B marketing.
If you still need a little help with your infographic design, we’d love to chat about it.

Let's upgrade your marketing game
Get fresh tips, how-tos, and expert marketing advice every week. (15,000 people already are.)