
Infographics are an excellent way to communicate, and the right infographic ideas can help deliver a lot of content in an easy-to-read format. And, yes, they do look pretty. But they’re much more than a pretty package. When used correctly, they are a powerful storytelling device. By combining great visuals, great data, and great copy, they stimulate powerful learning centers in the brain, helping connect ideas much quicker than images or text alone. (If you want to learn more about their application, check out our guide to infographics.)
So how do you put them to work for you? Whether you’re a newbie who’s never worked on one before or a seasoned content creator who’s produced a ton of infographics, remember that all good infographics start with good infographic ideas.
I’ve sat through a couple thousand infographic brainstorms, and I know firsthand that coming up with a killer idea doesn’t always happen at will. So, to make things easier—and share some hard-earned knowledge—I’ve compiled a list of some engaging and tried-and-true ways to come up with great infographic ideas, as well as a few examples to inspire you. I hope it helps your next brainstorm.

16 Tips for Infographic Ideas
1. Industry Trends
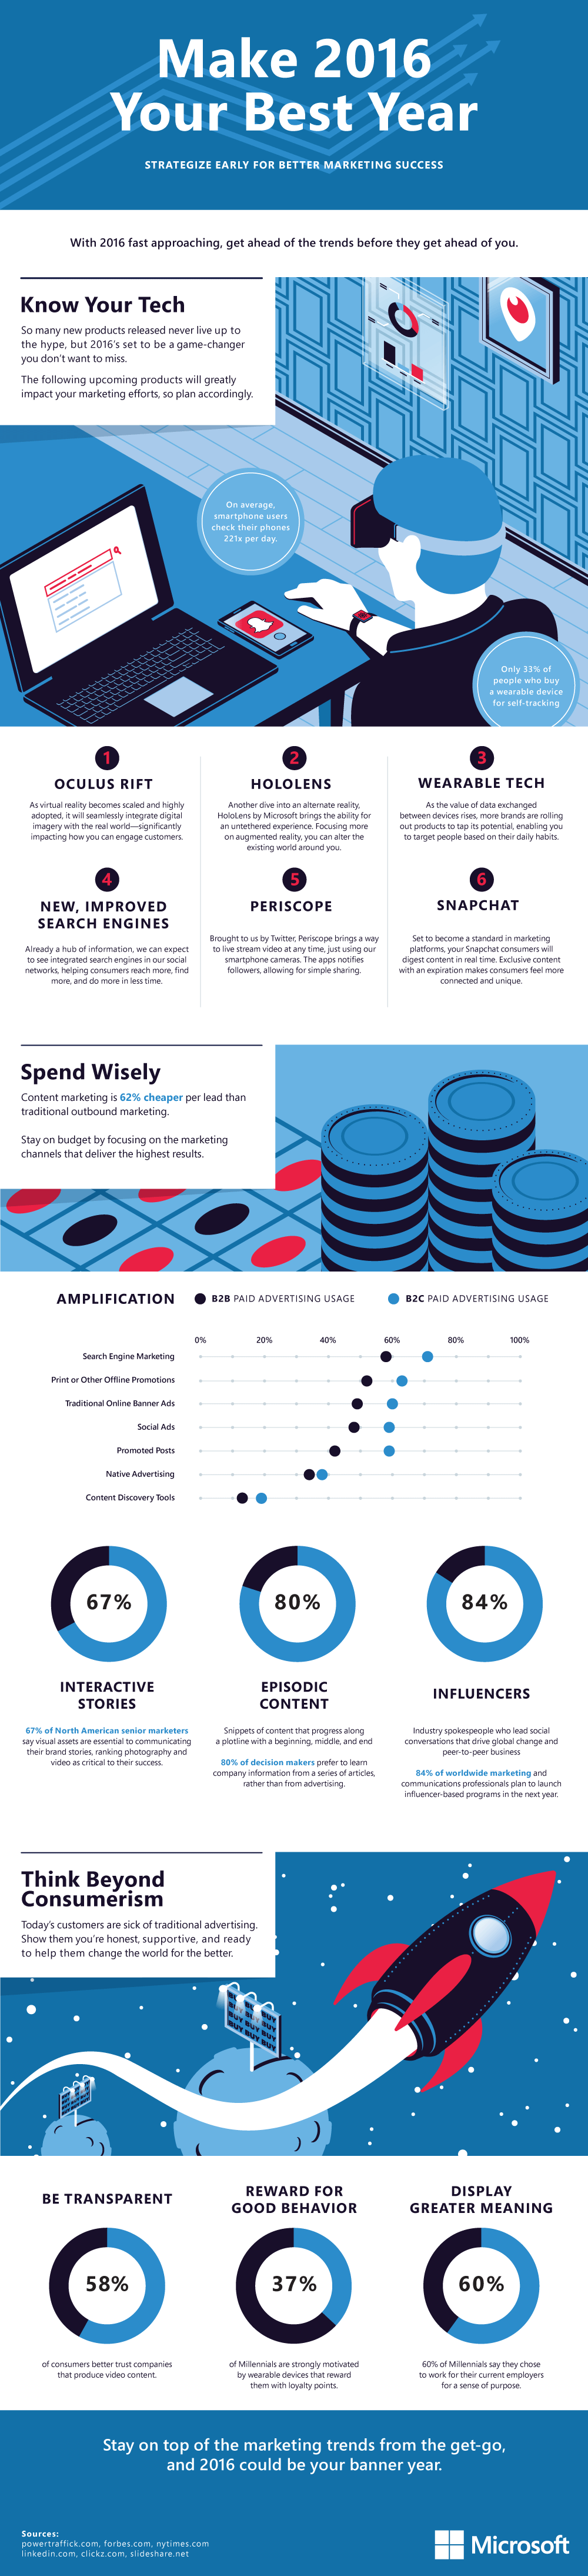
You’re consuming information relevant to your industry all day: newsletters, articles, blogs, think pieces, reports, etc. These can all be great fodder for an infographic. Next time you run through your bookmarked content, think about what information stands out and how it might be translated into a piece of visual content.
If a particular item you come across stays with you—or irks you—there is probably a great infographic idea somewhere in there.
2. Pop Culture Trends
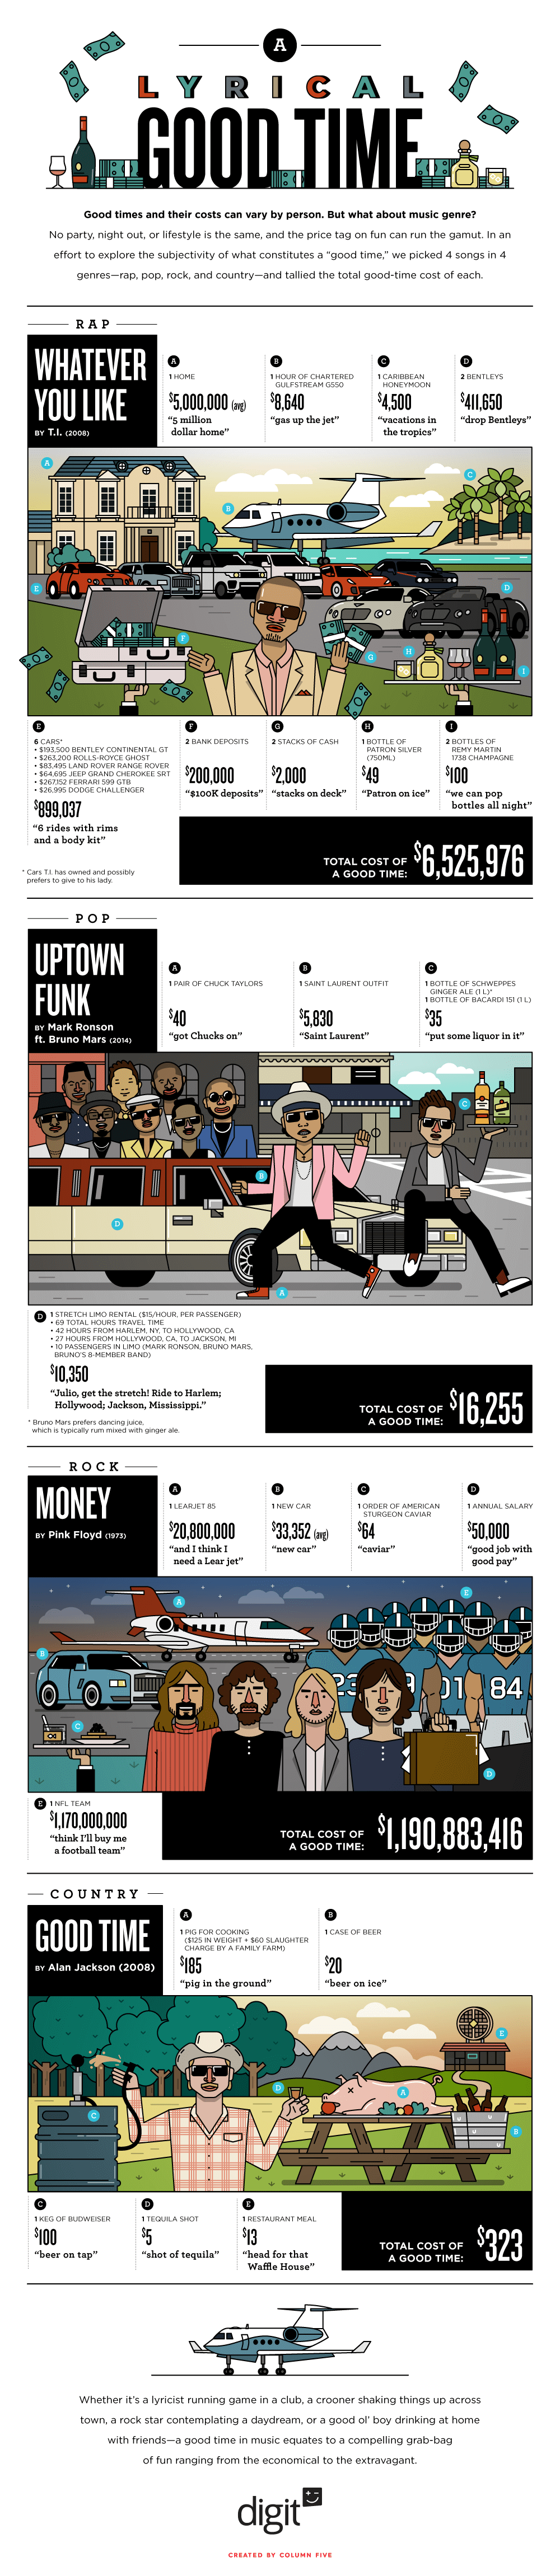
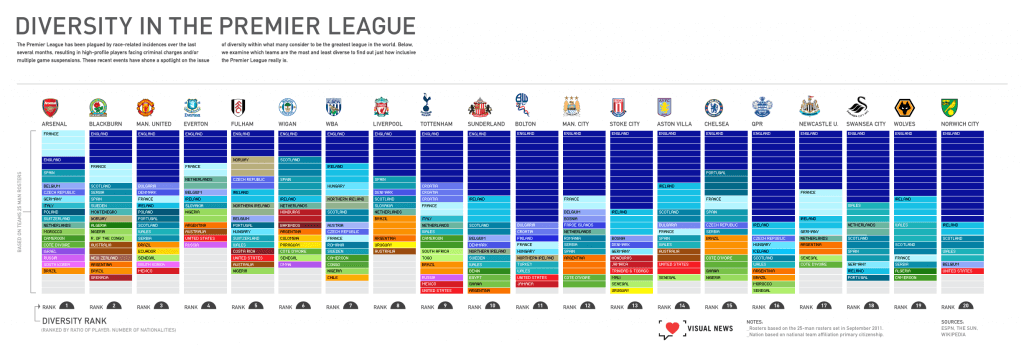
Music, entertainment, sports, fashion—these are great sources for infographic ideas. These popular subjects are always trending and, when gamed right, can help elevate the visibility of your infographic. We’ve visualized everything from rap artists’ lifestyles to breakdowns of blockbuster movies, so the options are pretty endless.
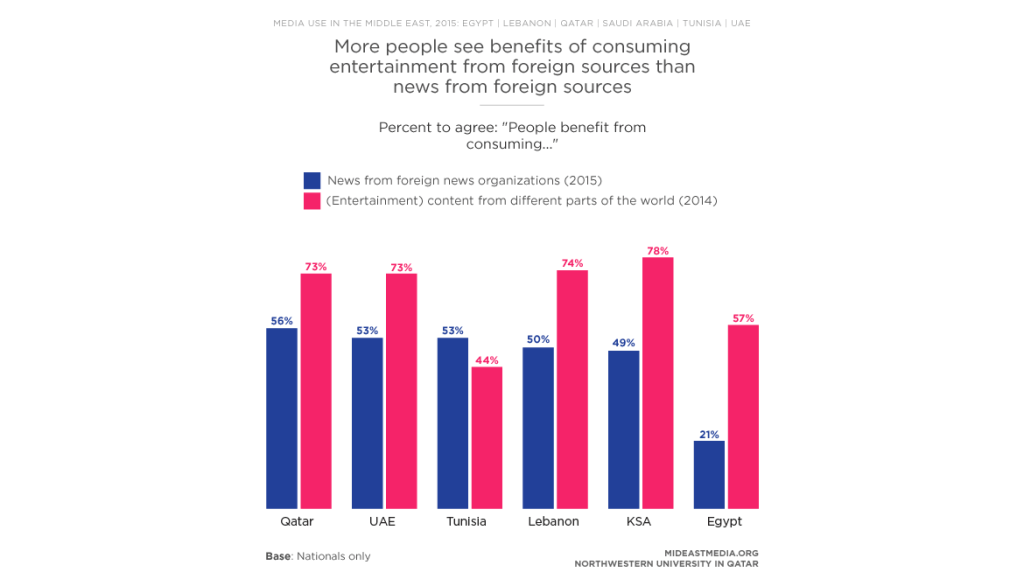
3. Social Trends
Cultural trends can be a powerful source to tap into for infographic inspiration. Organizations like Pew Research are constantly releasing reports on a variety of issues relevant to the larger culture, from demographic data to social opinion polls.
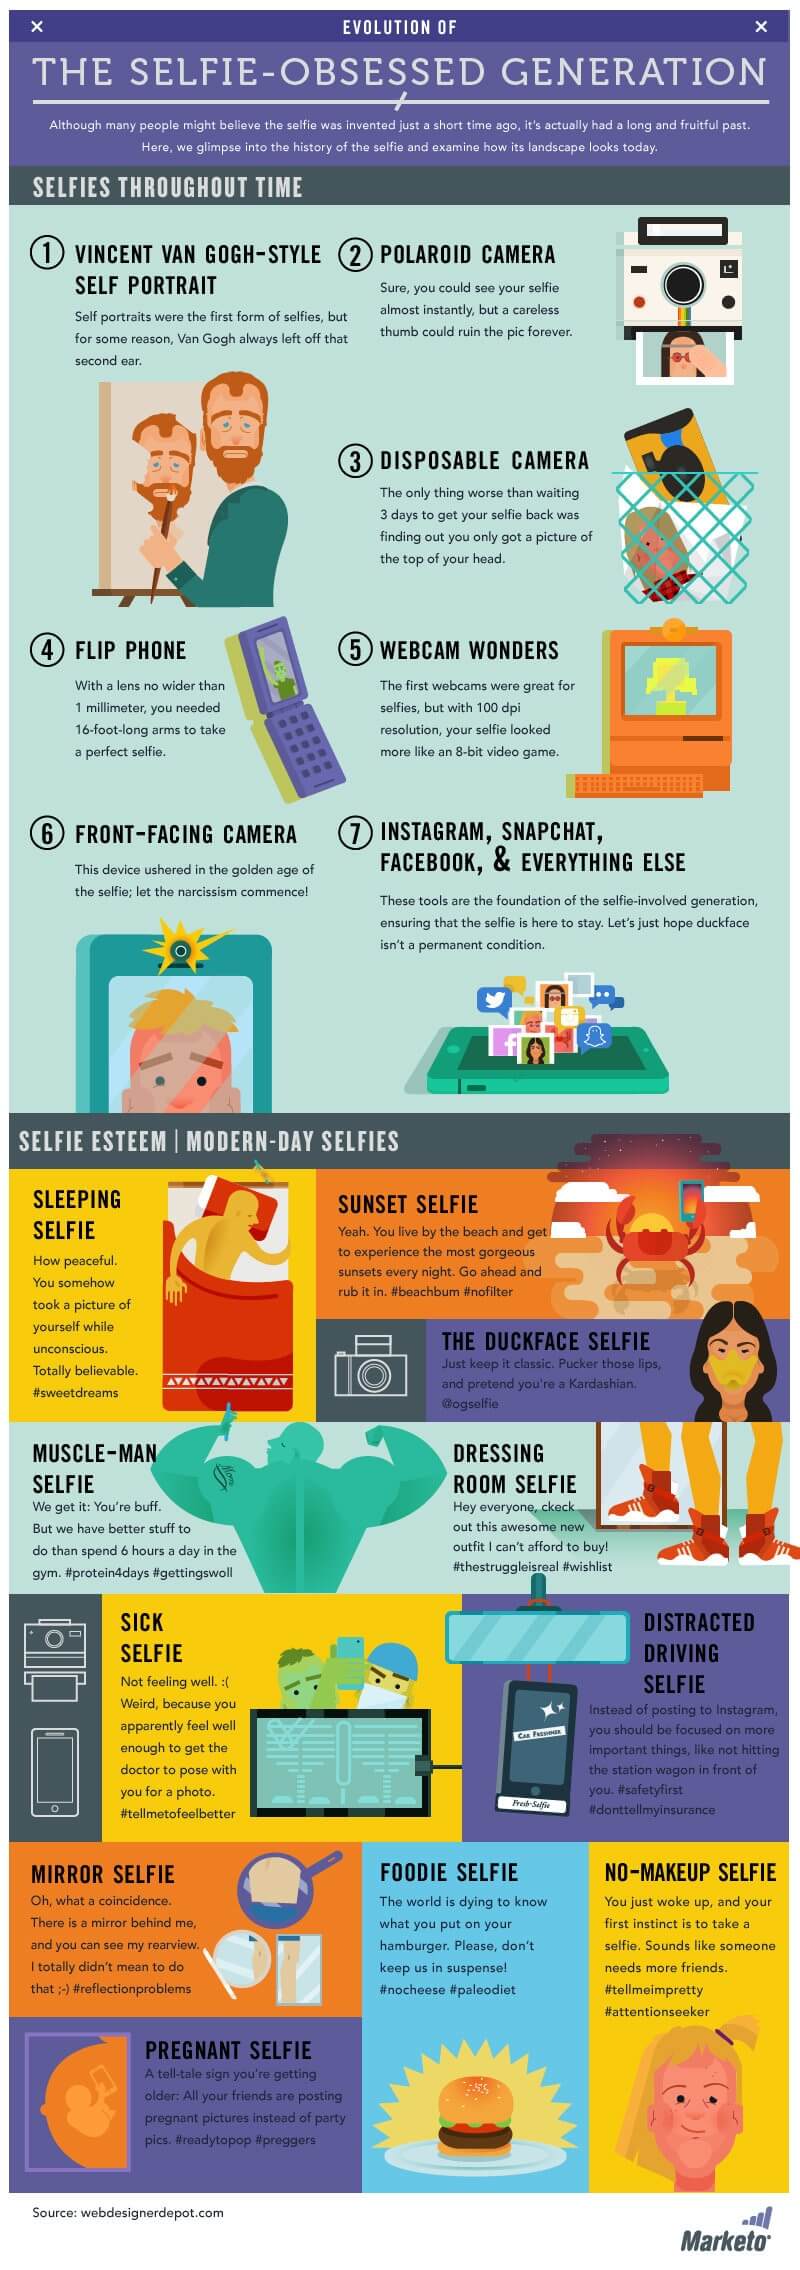
Whether they’re serious or light-hearted, broad or niche, think of how these trends may be turned into interesting infographics. For example, we’ve previously tackled the selfie-obsessed generation and the brunch phenomenon.
4. News Items
There’s no shame in newsjacking. It’s a great way to insert yourself into the conversation. For example, when California’s drought was in the news (and our SoCal HQ office was withering), we created our “7 Ways to Hack a Drought” infographic to spread the word on water conservation.
Monitor headlines and take a look at Google Trends to keep your finger on the pulse. One caveat: Avoid tragedies or hot-button political issues. We’ve seen too many brands mess up royally. (See our tips to make sure you’re newsjacking the right way.)


5. Upcoming Events
Ideally, you’re working ahead and carefully planning your editorial calendar. Make sure you’re regularly reviewing upcoming events—everything from major holidays to movie releases—to spot any opportunities to plug in content.
Tip: Forekast is “the Internet’s calendar,” and it tracks holidays, awareness months, etc. We’ve used it to inspire everything from our interactive infographic in honor of Black History Month to a camping guide to Coachella.

6. In-House Data
One of the best ways to differentiate yourself from your competition is to tell unique data stories. Not only are these interesting to consumers—and the press—but they are totally original because they’re based on proprietary data. (Translation: Your competition can’t copy them.) Beyond annual reports, case studies, or sales data, there are so many ways to find unique stories in your data. See our guide to data storytelling to turn your spreadsheets into great content.
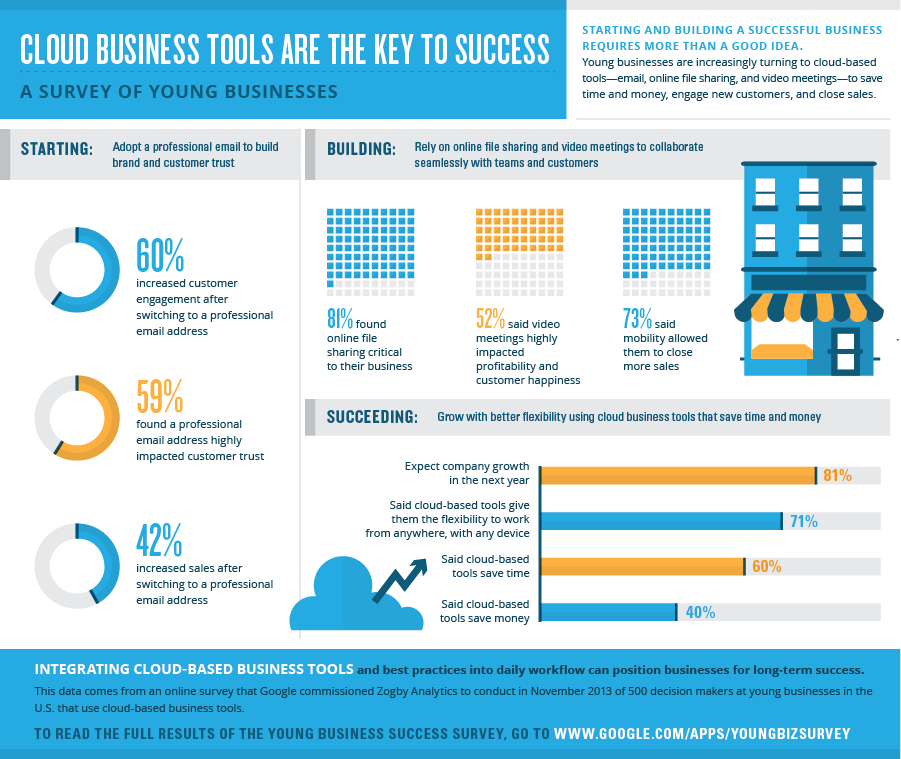
7. Surveys
Whether you coordinate with your marketing team to poll your own customers or wait for a major industry publication to release their most recent survey results, this data is ripe for visualization. Pair it with a structured narrative, and you have infographic gold.
We especially enjoyed working on CWIF’s Egg Tracker Interactive Report. It was a ton of data made easy to understand through visualization.
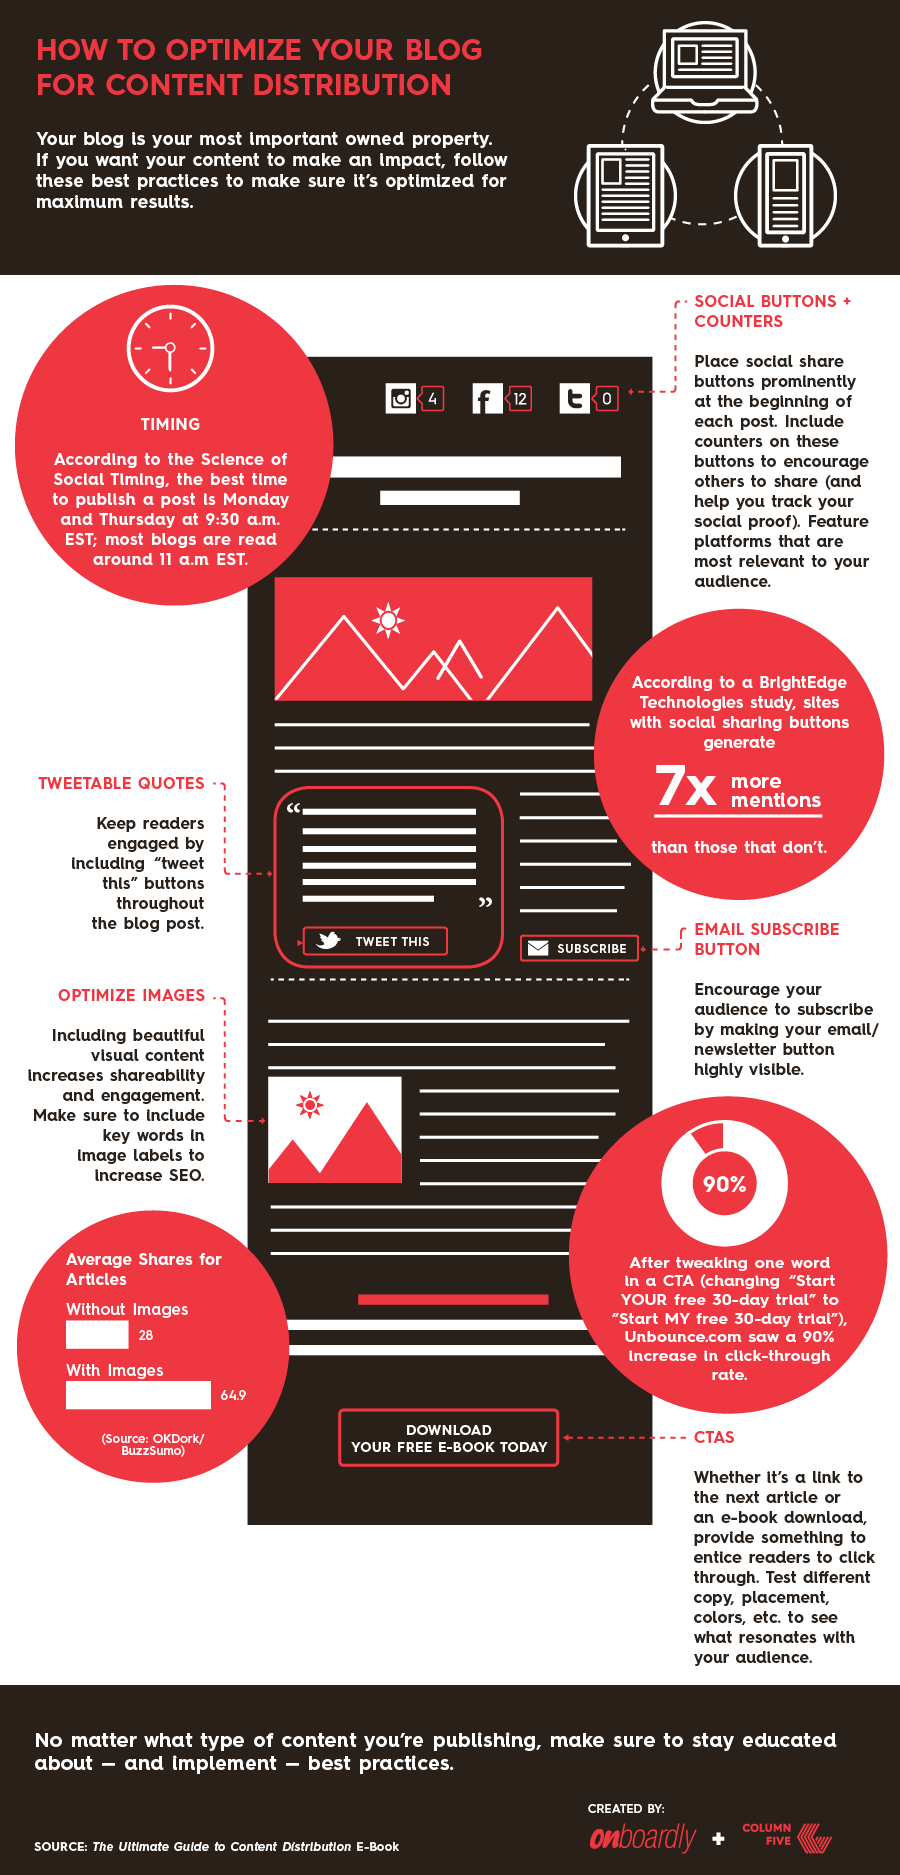
8. Existing Content
If your brand has been actively content marketing, then you likely have an archive of previously produced content. Everything from blog posts, to press releases, to case studies can be repackaged to tell a new story. This is the easiest and leanest way to get more mileage out of your existing content.
For example, we turned a section of our Ultimate Guide to Content Distribution e-book into an infographic on how to optimize your blog for content distribution.
9. Company Culture
Content marketing is vital to a company, but culture marketing is also integral to your brand. If there are causes, hobbies, or other things that are of particular interest to you and your coworkers, let them feed your infographic ideas.
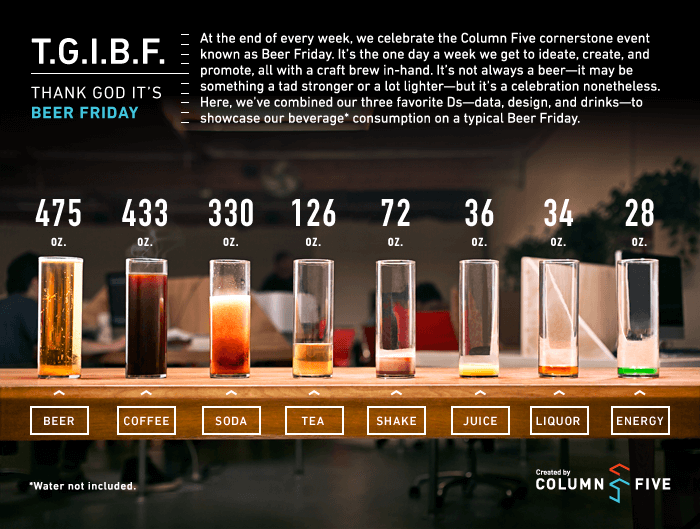
For example, after a discussion on women’s health, our team created the#PeopleForPeriods interactive, which aims to help destigmatize the discussion of menstruation. We also once tracked our Beer Friday consumption.
10. Academic Studies
There’s no substitute for amazing scientific data, especially when it helps support the fresh perspective and message you’re trying to convey. Google Scholar can help you search a ton of studies in a variety of fields, from social psychology to tech. You can use this to inspire your next idea or to help enhance one you already have.

11. Government Reports
There is a wealth of public data available from every branch of the government, all of which can be put to good infographic use. Most of it is easily accessible, and each organization has an active newsroom that puts out press releases for notable findings, which can be a great source of infographic ideas.
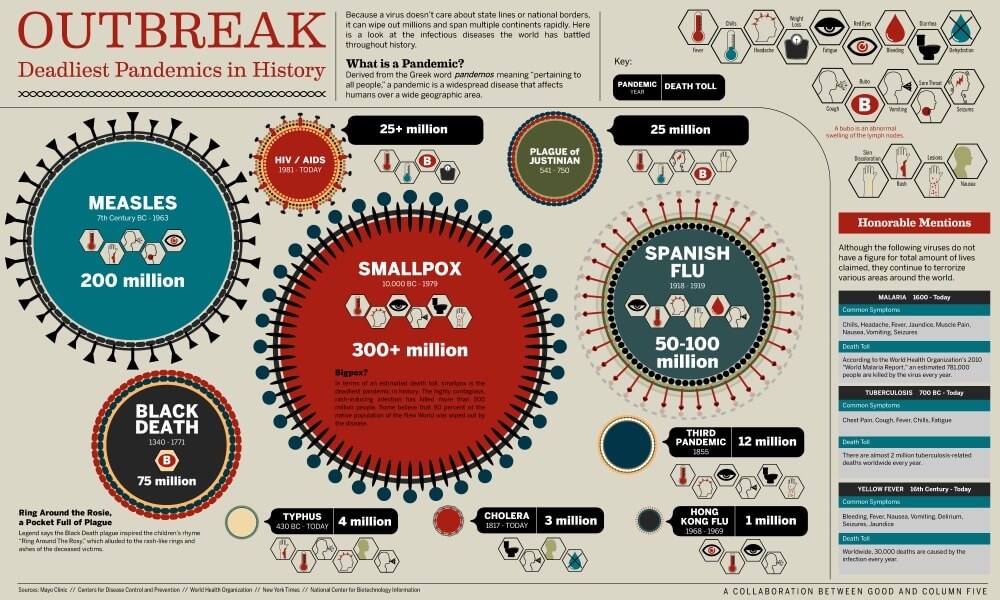
Here are 00+ data sources to comb for inspiration. You can bookmark particular findings or pull a stat to chew on later. For example, we used public health data to create this infographic on pandemics throughout time.
12. Target Keywords
You are making an infographic for a reason: You want it to be seen. You know evergreen pieces will give you the most value for the work you put into them, so why not use SEO to your advantage?
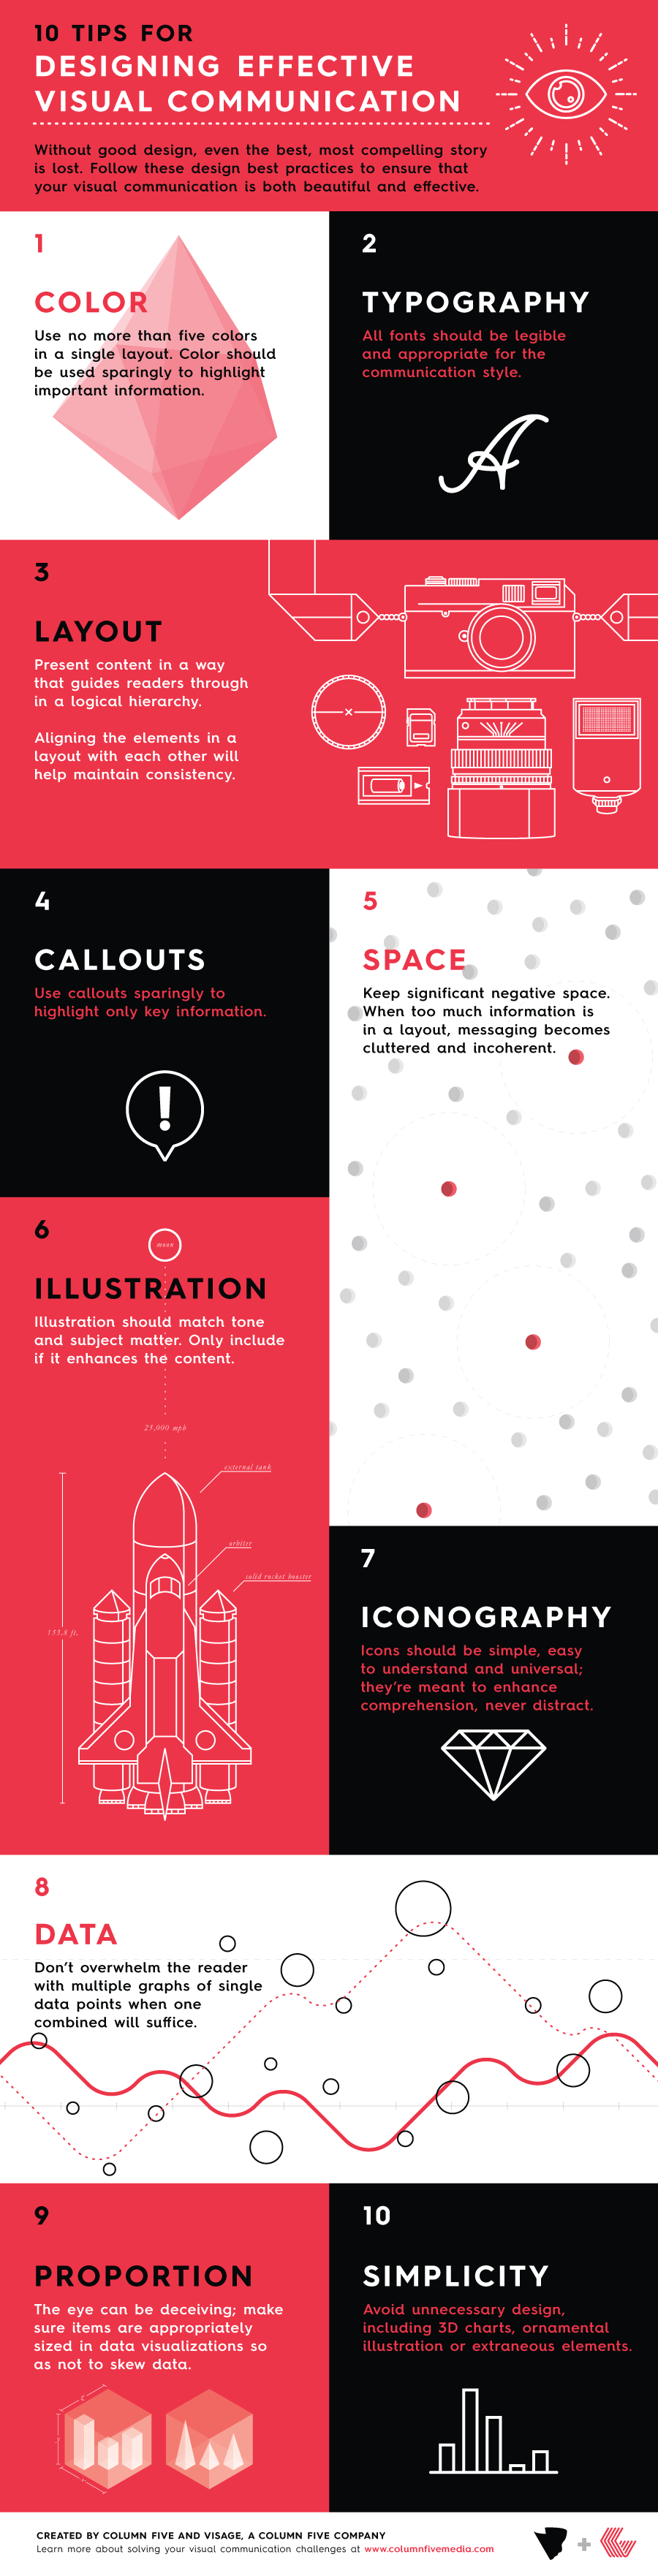
Depending on your goals, you’ll want to search relevant keywords to see what terms you might rank for. Consider what type of subjects or angles might be relevant to those search terms, and turn them into an infographic. For example, we created this infographic on designing effective visual communication to help our SEO as a design agency.
13. Tutorials
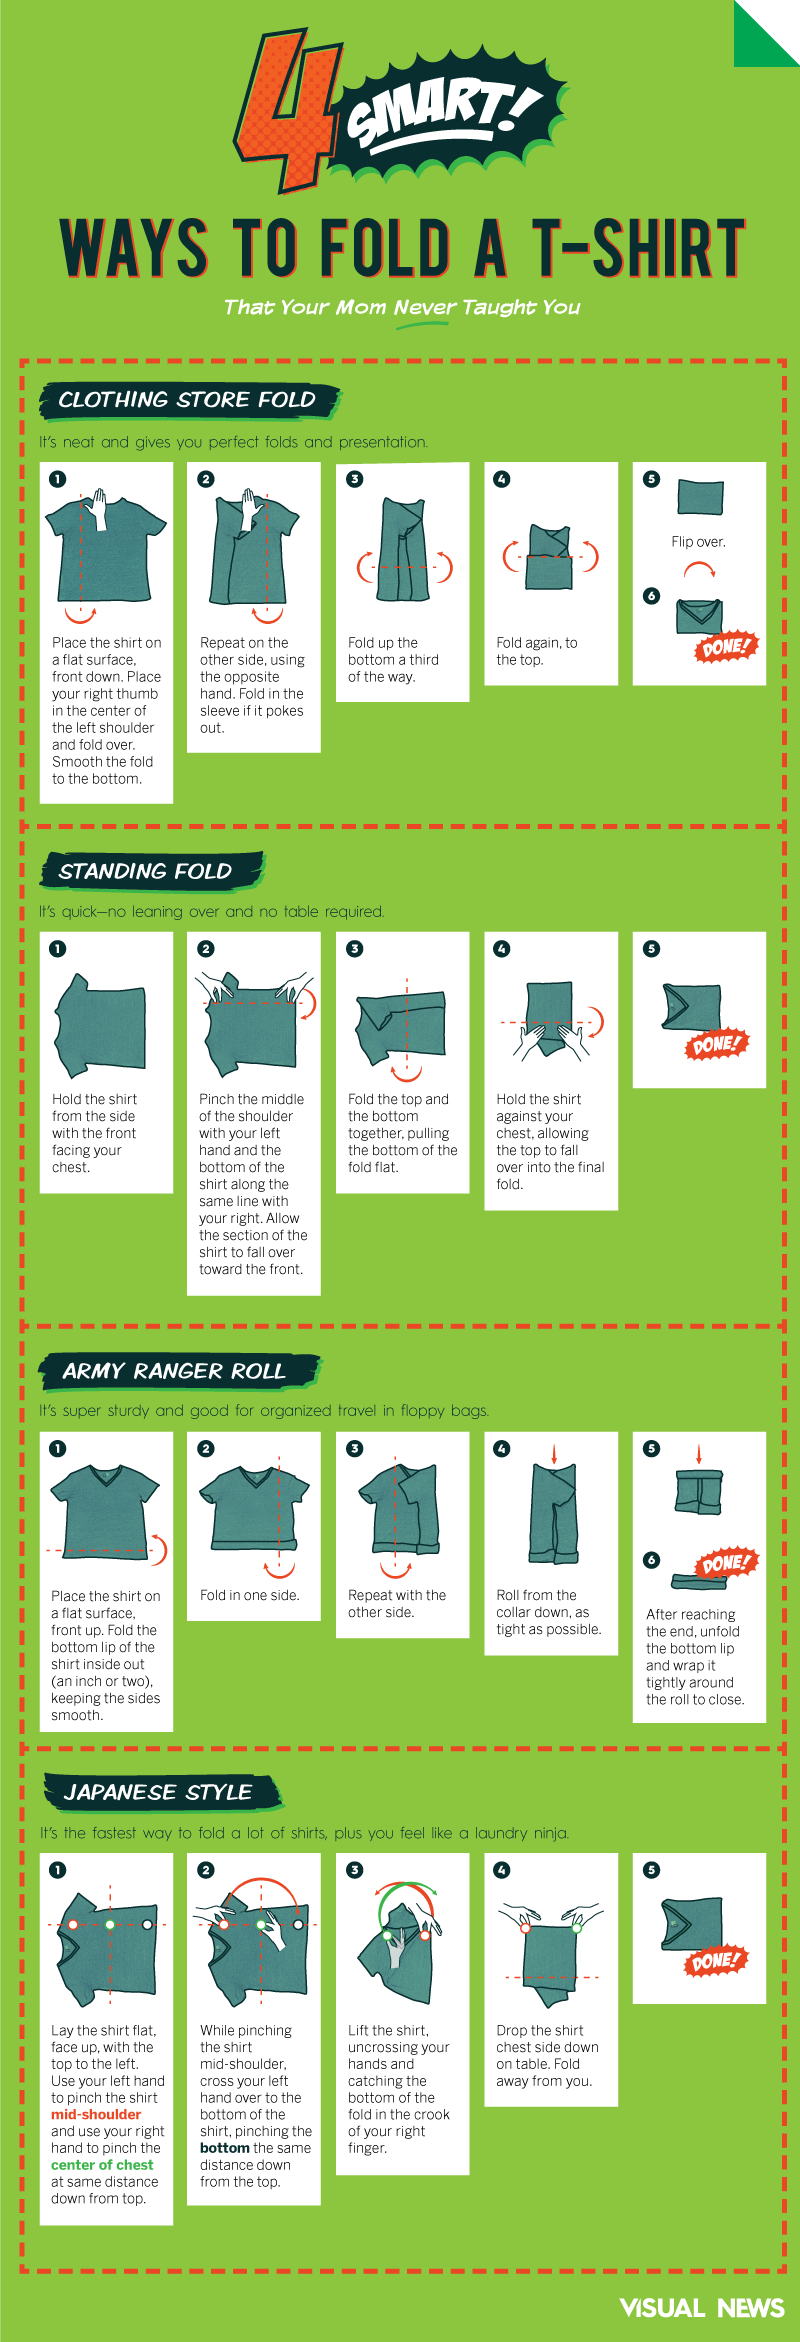
You can tell someone how to do something, or you can show them. Infographics are a powerful form of information design, so they’re ideal for tutorials. However, simply slapping pictures and words together doesn’t mean you’ve created a clear and easy-to-follow instructional infographic. You need to use visual cues and strong copy to effectively guide people through a process. For example, here’s a tutorial we made about the 4 ways to fold a shirt.
14. Something Someone Else Did
How many times have you come across a killer piece of content and wished you’d thought of it? It can be frustrating, but odds are if you thought of it, you can also think of ways to make it better.
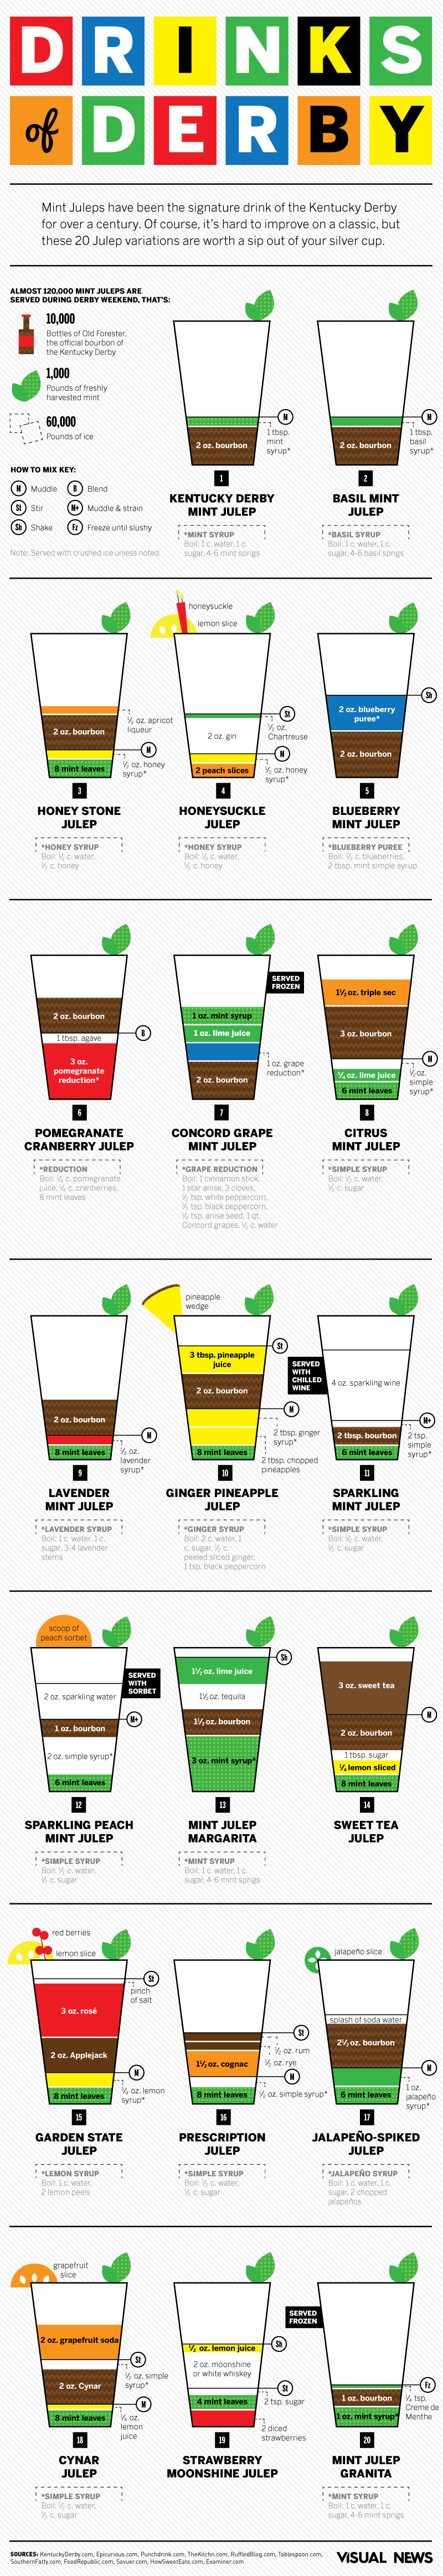
Good content is about providing great value. If you can do something better, do it. Over the years, we’ve seen plenty of visualizations for particular cocktails, but when the Kentucky Derby came around, we decided to visualize how to make multiple versions of the classic Mint Julep. It was a specific spin on a visualization style plenty of other people have done, but we made it our own.
15. Company Materials
Time, energy, and attention are precious commodities. Communication in the digital age should focus on making the biggest impact in the least amount of time. Take a look at your existing company materials: sales brochures, press releases, employee handbooks, etc. It’s likely there is material in there that can—and should—be visualized to create a more efficient and enjoyable experience for customers and even employees.
This is a great opportunity to demonstrate your creativity to turn these boring pieces into visual gold. A great example of this is marketer Amos Haffner‘s resumé, which he turned into an infographic.

16. Your Personal Passions
If there’s something that you particularly love, or are just curious about, you can sometimes find a unique angle that might be worthy of infographic exploration. It’s especially impactful if you turn your company values into interesting infographics about causes you care about or ideas you want to promote. This helps you share your beliefs and cultivate a community around them.
How to Create Your Infographics
We hope these prompts have inspired a slew of ideas to keep your publishing calendar full. If you’re ready to bring those ideas to life…
- See our guide to create infographics according to best practices.
- Find out what types of infographics catch a publisher’s eye.
- Get 104 of the best free data sources for your next infographic.
- Follow our publishing checklist to make sure your infographic gets the most traffic.
- Avoid these design mistakes in your visual content.
And if you need any help creating your infographics, bring in professionals who can turn your concepts into professional-looking infographic ideas that truly resonate. Let’s chat about how we can help.

Let's upgrade your marketing game
Get fresh tips, how-tos, and expert marketing advice every week. (15,000 people already are.)


Very nice infogrpahics. Contact me for more details
I need an infographic idea about change.
Feel free to get in touch: https://www.columnfivemedia.com/contact/