With over 4,000 under our belt, we’ve learned a lot about how to make infographics in our time. (We even wrote a book about it.) It’s been over a decade since we started, and although the publishing landscape has changed since our early days of million-view infographics on Digg, they’re still a great way for brands to build brand awareness and communicate with the world. (They also have plenty of applications within your organization, too.)
The medium has also evolved since we’ve been in the game, allowing marketers to create more exciting, dynamic infographics than ever.
That said, there are still a lot of awful infographics in the world. Some look great, some just need a little tweaking, and some are a straight-up nightmare. We know you don’t want to be in the latter category, so we’ve created this complete guide to walk you through every stage of making an infographic.
Having made infographics for everyone from small startups to Fortune 100 companies, we’ve learned what works and what really throws a wrench in the process, so we’ve included our best tips, plus resources and templates to make it easier at every stage. Let’s do this.
5 Questions to Ask Before You Make an Infographic
People often get excited by the idea of an infographic and want to dive into design immediately, but the process to make a successful infographic starts way before you ever come up with an idea. An infographic is simply an extension of your larger content strategy, so you need to make sure your team is completely aligned before you schedule your first brainstorm. (This is why we start every client engagement with a kickoff call to establish the g. roundwork for the project.)
If you want your infographic to succeed, here are the key questions to ask from the start.
1) What is your goal?
What are you trying to achieve with this piece of content? How does it fit into your short- and long-term marketing goals? Wanting to create an infographic because infographics are “cool” is not a reason. It can actually be a huge waste of time if it’s not tied to your larger strategy.
2) Who are you trying to reach?
If you want your infographic to succeed, knowing who you want to reach is paramount. You should be able to identify your audience segments, as well as their pain points and desires. This will help you create an infographic they actually care about.
If you don’t have a strong sense of your audience, download our personas template and follow our guide to build them.

3) Is an infographic what you need to achieve your goal?
This is a big one. Way often see people get excited about a certain format or trend and go all in. Sometimes they want to create something because a competitor did. Other times they just want to appease a higher-up who wants what they want because they want it. Over and over, we remind people that format should be determined by the story you’re telling.
An infographic may work, but a GIF series, interactive infographic, motion graphic, or video might be the better solution. If you’re not sure, here are 6 ways to know if an infographic is the wrong format. You can also see our rundown of visual content types to determine what might work for you.
4) What channels will you use to distribute your content?
In our early years, we were always shocked to deliver a slick infographic, then find out our partner didn’t even have a blog to post it on. Knowing where your infographic will be distributed is crucial.
Infographics are an inherently visual medium, and while many platforms are made for visual content, their requirements can vary. Knowing where it will be seen will have a huge influence on how you actually craft and design your infographic in terms of content, sizing, supporting visual assets, etc.
See our guide to choose your distribution channels if you’re not sure where you should focus your energy.
5) How are you going to determine success?
Your KPIs will tell you whether or not your infographic worked; they should not be an afterthought. If you need tracking links or analytics set up, these are all things that should be locked down before you go into production.
See our guide to choose the right metrics for your content strategy if you’re not sure how you’ll measure success.
Other things to consider:
- Who needs to weigh in on the content created? Too many cooks in the kitchen or a major edit right before publication is a pain in the ass.
- Who will own the project? Decide who will consolidate edits from stakeholders, who will coordinate with design and PR, who will make sure that what’s created aligns with the project goal, who will problem-solve along the way, etc.
Once your team understands the project goals, you can move on to the fun part: coming up with awesome ideas.
How to Make an Infographic
The infographic process is pretty straightforward, but the most important thing to remember is that each stage builds on the other.

You need clear communication and sign-off at each stage to move things forward and create a piece of content that works for everyone. (Basically, by the time you see your first infographic design, you aren’t looking at an entire “first draft.” The idea and copy should have been locked and edited several times by the time you get to that stage.) There should be no surprises on the back end. Here, we’ll guide you through the specific steps to take to end up with a beautiful, valuable, and effective infographic to send out into the world.
Step 1: Brainstorm for ideas.
Too many brands try to make infographics for themselves—not for the people they’re trying to reach. Great ideas are only great if they work for the core audience. It’s easy to get hyped up on a fun or interesting idea, but it will ultimately fail if you forget who you’re creating it for.
Bring the right stakeholders together at this stage, including your copywriter, art director or designer, and PR. PR is particularly important, as they know what publishers and influencers are interested in. They can also help arrange exclusive placement with publishers or a cobranding opportunity, which can help you maximize your infographic’s reach. (Read more about how to approach publications for this type of content.)
Pro tip: To come up with interesting ideas, dig into your data. Proprietary data (aka your company’s own data) can be gold when you’re trying to find unique, original stories to turn into an infographic. Check out these 9 places to find data in your own company, or take a look at our roundup of 100+ sources of free data. You can also try these 16 methods for coming up with great infographic ideas.
News and trends can also be a great source of infographic ideas, but be careful with how you approach these. You don’t want your brand to come off as out of touch or insensitive to certain issues in the news. If you want to take this approach, find out how to newsjack without being a jackass.
Note: Brainstorms can be tricky when you have a lot of stakeholders (or egos) in the room. Learning about the 4 different types of creative brains, including what type of thinker you are, can help you collaborate and communicate much more effectively. If you need a few tips to get the most from your brainstorms, you can also take a look at this handy slideshow.
Step 2: Vet your ideas.
A freestyle brainstorm sounds fun, but you’re here to achieve a goal. Vet every idea to make sure it really will capture people’s interest.
- Does this solve a problem, expand their knowledge, or have a practical application?
- Is it relevant to them?
- Would they want to share it?
- Has this been done already?
Note: Just because something has been done before doesn’t mean you can’t do it. If you can do it better or give it your own spin, it can be a great idea.
Step 3: Write a creative brief.
Once you have your idea, you need to make sure everyone on your team is on the same page—literally. A great creative brief communicates everything that anyone working on the project needs to know.
If you don’t have these details documented and easy to access, you might end up with an infographic optimized for web publication that was supposed to be an enormous visual for a tradeshow presentation (not that that’s ever happened to us).
To write a comprehensive brief, download our free brief template and follow our guide to writing creative briefs your team can actually use.
Also, we find that there can be some confusion when talking about infographic creation. Before you head into production, make sure your team is using the same language for clear commuincation. A few terms to know:
- Data visualization: Strict visualizations of data, which include charts and graphs.
- Infographic: A graphic combining copy and data visualization.
- Information design: A graphic that visually displays information but not necessarily data (e.g., a flow chart).
- Interactive infographic: Web-based content that users can interact with and/or manipulate.
- Animated infographic: An infographic that features animation (aka movement). It’s sometimes called a GIFographic.
Once you’re all aligned, you can start the most exciting phase: content creation.
Step 4: Craft a story.
A lot of people think infographics are eye-catching and therefore effective, but that’s way off. A well-crafted infographic is effective because it tells a story. Combined, the text and visuals make that story easier to understand. Your words are the backbone; design enhances your words. The stronger your story, the better your infographic.
The most important thing to remember is that a good infographic tells a single story. We’ve all encountered monster infographics that never seem to end. It’s tempting to cram as much as you can into your story, but an infographic is effective when it tells a strong and straightforward story that brings more clarity to a topic.
If you have multiple angles or aspects of a story, it may be better told through a series of infographics.
Here’s a good litmus test: Is it easy to write the headline for this story? Can you summarize your message in a few sentences (or a PR pitch)? If you have trouble writing your story succinctly, people will have trouble understanding it.
As you craft your story, keep these tips in mind.
- Structure content in a logical hierarchy. Good design starts with copy. The better you structure your content, the easier it is for users to follow the story and for designers to lay it out intuitively.
- Write to your reader. You should be telling a story they want to hear—and telling it in their language. Write to their level of understanding, explain terms that may be unfamiliar, and avoid unclear jargon or buzzwords.
- Channel your brand voice. Your brand is made up of humans. Your brand voice should be human, too. No one likes corporate speak or dry language. Always give your content a second edit for tone and word choice. (Here are a few more ways to take the BS out of your content too.)
- Don’t get too clever. Sometimes marketers get excited about a certain story concept or metaphor, but if it doesn’t fit the story, it will do more damage than good. (Would a beauty brand campaign be about “scoring a homerun”? Probably not.) The same goes for headers. Be careful with puns. People want to know what the infographic is about—not decipher some obscure reference.
- Kill redundancies: Be as succinct as possible. Context is important, but there’s no need to over explain. Design is there to do the heavy lifting and bring elements to life, so let it do its job. If a graph shows a 50% increase, the body copy, subhead, and callout do not need to reiterate the 50% increase.
- Watch your wordcount: Infographics are not term papers or opportunities to prove to the world that you went to grad school. In fact, they require much less text than you’d expect. Condense and cut as much as you can. This allows more breathing room for design and helps you keep your story tight.
- Edit and approve: Save yourself headaches and make sure everyone signs off on copy before you go into design.
Note: If you’re crafting a story around data, that is its own art.
- Tell a true data story. Just adding a single stat to your infographic doesn’t mean you’re doing data right. A great data story extracts meaning and insight from a data set. Try these 5 tips to find stories in your data if you’re stuck.
- Don’t manipulate, misinterpret, or misrepresent data. This is also why it’s important to use a credible, non-biased source for data.
- Provide context and insight. When you do have a strong story (ideally from a single, solid data set), provide context and insight to guide your reader through the content. And please don’t stuff your infographic with every single data point just because you can.
For more help, find out how to craft a strong infographic narrative.
Step 5: Design according to best practices.
Great infographic design is meant to enhance copy, increase comprehension, and make the content as visually appealing as possible. The number one question to ask when designing: Does this serve the story?
That said, there are plenty of small and big things you can do that will affect how people interpret the story and experience your infographic.
- Know your specs. Are you designing for print? Social? Web? Mobile? Responsive? What’s your resolution? This is relevant not just for practical reasons but to help achieve your goal. If the goal is to increase FB followers, the infographic better be optimized for social.
- Read the content before you design. It’s an obvious one, but it’s important. You need to know what you’re really trying to express, and you need to double-check that all copy is there.
- Design according to best practices. Your design elements and copy should work symbiotically to tell a cohesive story—rather than design just reiterating what the copy already communicates. Avoid these 15 common infographic design mistakes.
- Design data accurately. Good data design doesn’t just depict data; it uses design to enhance comprehension and bring clarity to complicated subjects or concepts. Find out how to design the most common charts and graphs effectively.
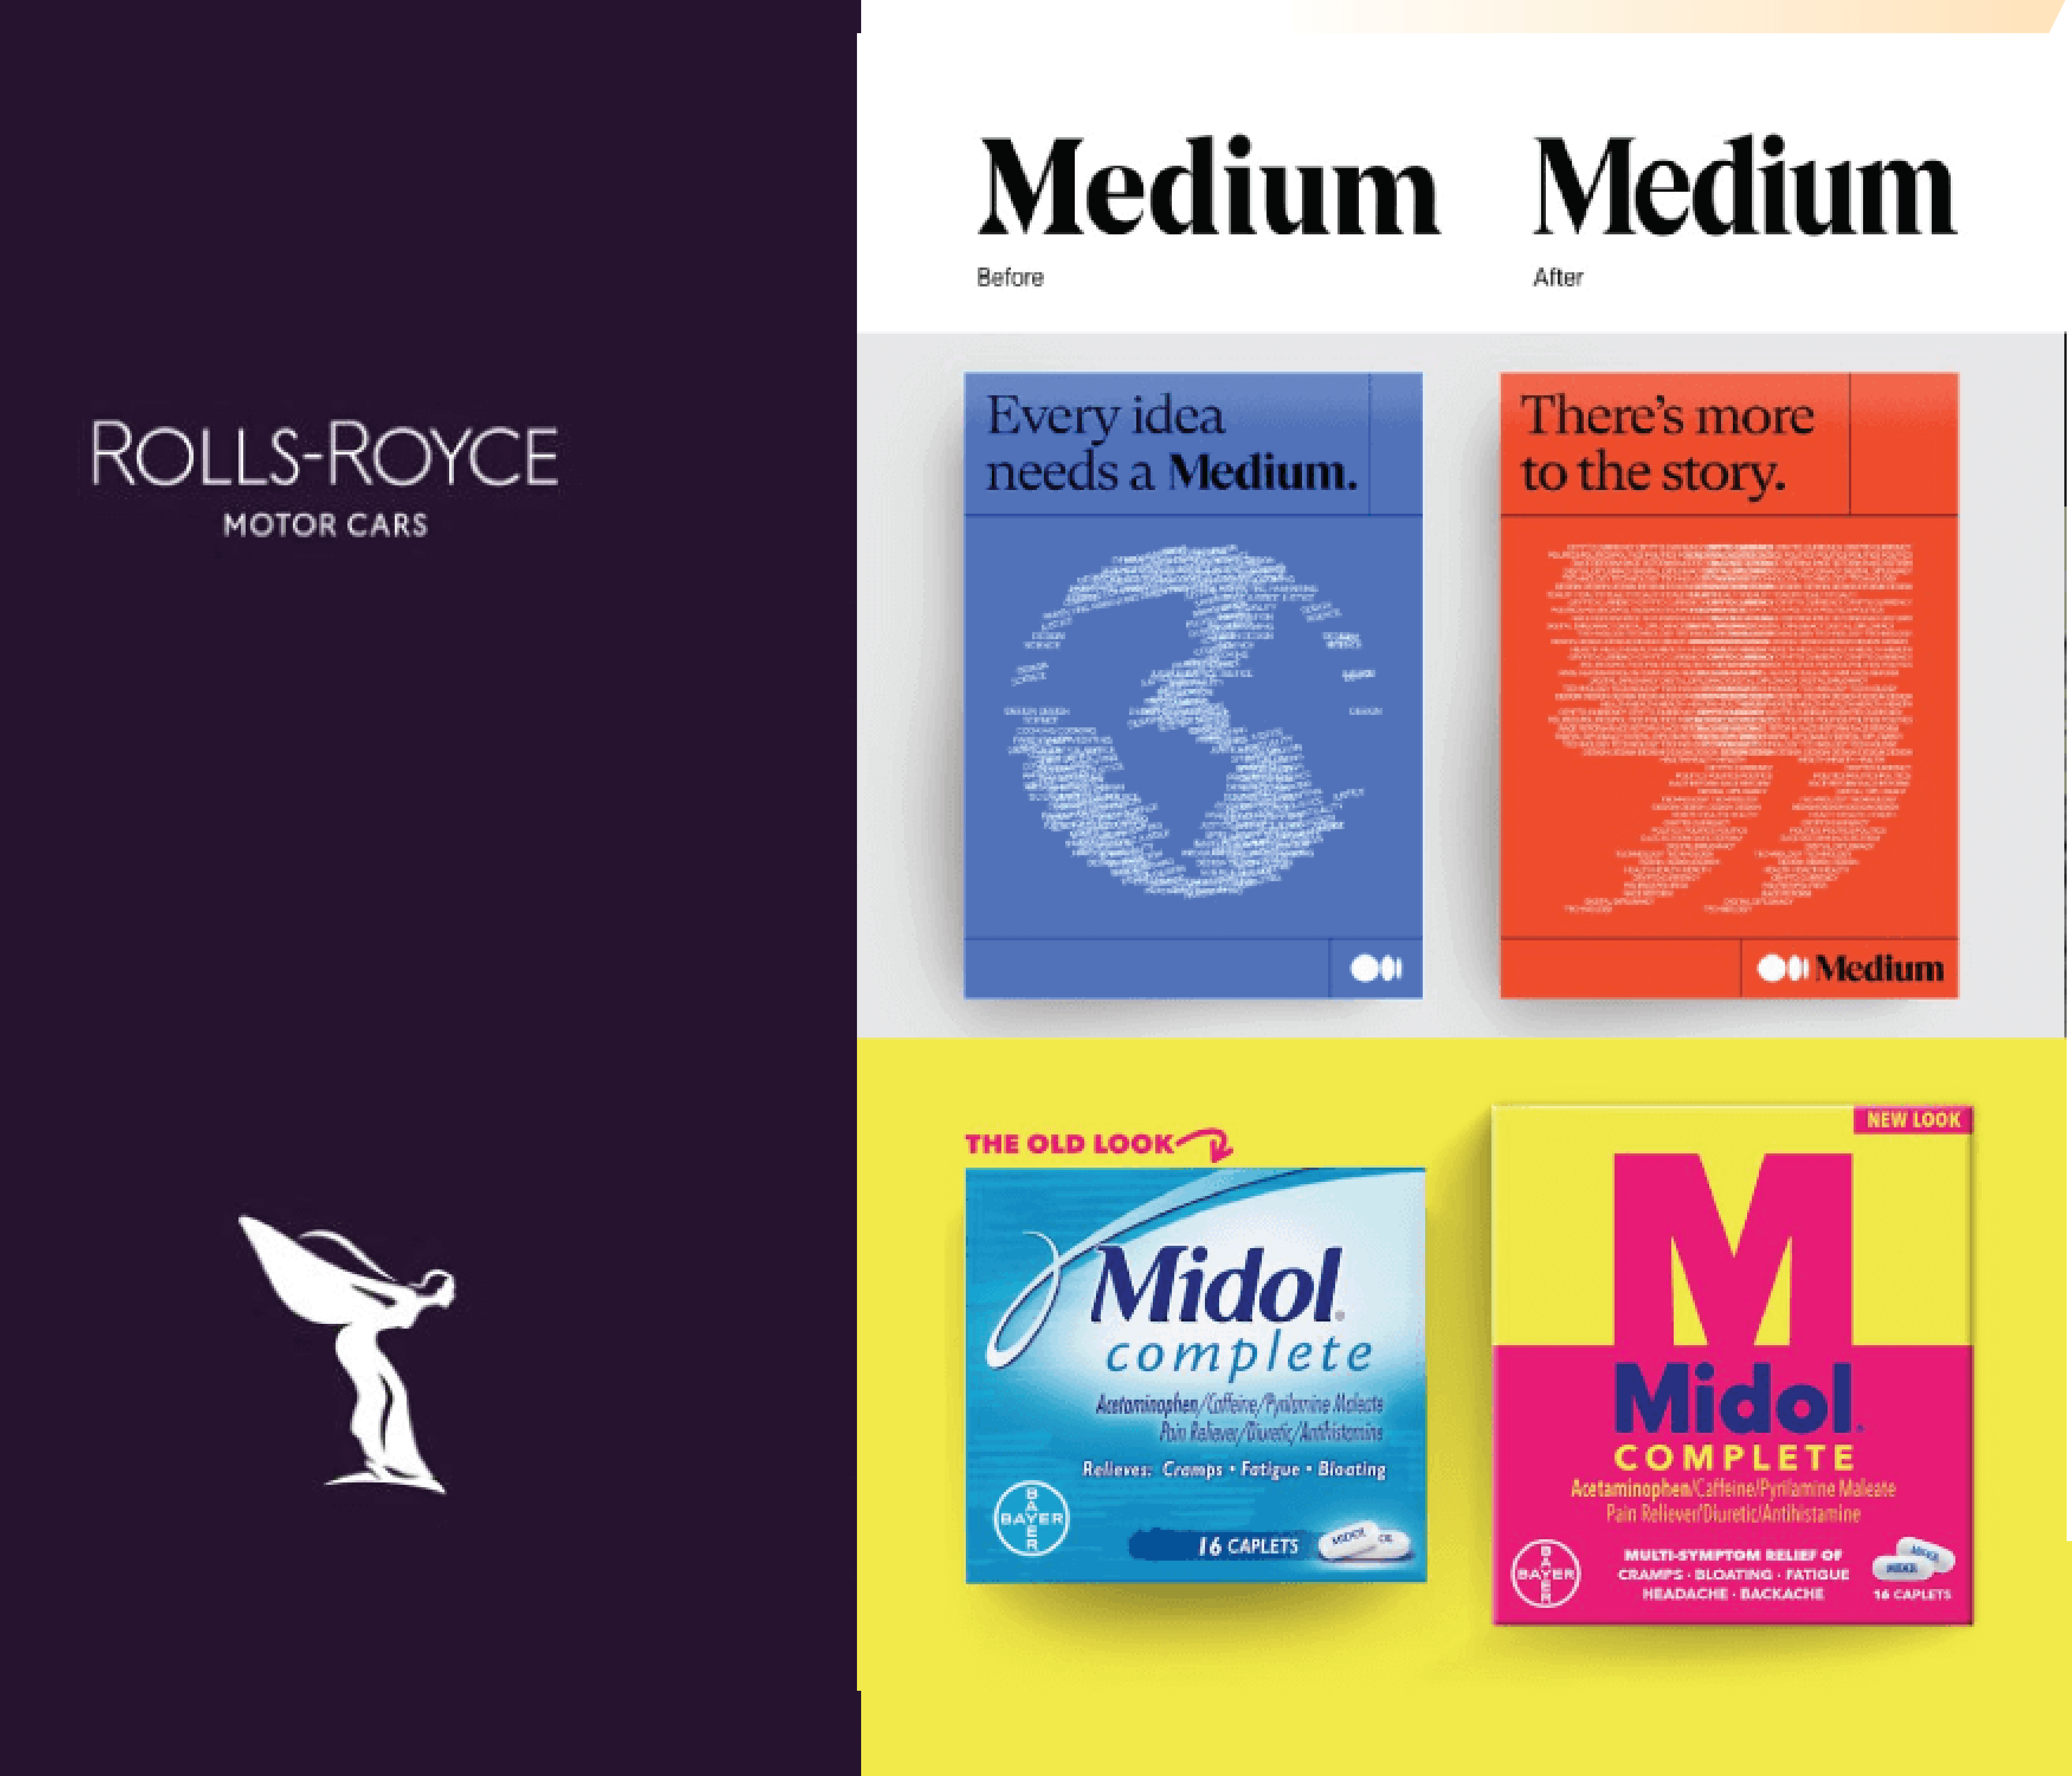
- Apply your brand identity. Every brand needs a visual language. Imagery, photography, and iconography are all tools to communicate your brand story, so follow your brand guidelines! If your brand is all about minimal line drawings, a brightly colored photo-based infographic is a fail. For more on that, find out how to make your infographics match your visual language.
- Be consistent. We’ve seen six different typefaces in a single infographic, 2D and 3D illustrations combined in one infographic, and plenty of other design eyesores across the Web. Again, your brand’s visual language will likely have guidelines for these things, but keep an eye out for consistency. You should also avoid these 8 design mistakes in your visual content.
- Solicit useful design feedback. Ask the team to tell you what they think is working and what is not working instead of what they like and don’t like.
- Experiment with your design. Not all infographics have to be static illustrations. If your visual language allows, try these 7 design styles. Or if working with papercraft, photography, or motion is off the table, check out these examples of minimal but effective infographic design.
Example: We turned our infographic about the trends for the future of infographics into an animated infographic for INC, which helped us tell the story in an even more exciting way.

Remember! Before you send your infographic into the world, triple-check that the copy is clean and the design is on point.
- Is all copy there?
- Are there typos?
- Does it have a logical flow?
- Is everything aligned?
- Are data visualizations accurate and best represented?
- Is the resolution correct?
Nothing’s more embarrassing than a major error. (Let’s not forget the Fox News pie chart that totaled 193%.)
Step 6: Distribute your infographic.
Writing a great story and designing a stellar infographic are only half the battle. Getting eyeballs on your work is what will help you ultimately succeed. To help your team distribute the infographic effectively, take these extra steps.
- Optimize your infographic for SEO. Make sure you have the right file names and keywords to get the most SEO traffic. For a full rundown of everything you need to do, follow our guides to optimize your infographic for SEO and optimize your blog for infographic publishing.
- Create shareable assets. Coordinate with your design team to get assets for your channels. Make sure you have the right resolution, file formats, and sizes, whether it’s going out via email, blog, or social. (Breaking up an infographic into different assets is a great way to get more mileage from the content. You can read more about how to do that with a divisible content strategy.)
- Craft a compelling pitch. If you’re trying to get coverage in publications (and you should be), you need a pitch that explains why your infographic is interesting and relevant to their readers. Think attention-grabbing subject lines, key takeaways, story angles, etc. For more, follow our tips to get publishers interested in your infographics.

Remember: Infographics Are Just One Piece of the Puzzle
We hope these tips help you think critically about the infographics you create. Of course, things are always changing, which is why it’s important to stay up-to-date on best practices for all facets of content marketing. As you go forward, look for opportunities to keep improving, working efficiently, and refining your process. A few final tips before you go:
- Don’t let your infographics go to waste. Find out how to repurpose your data visualizations, bring old infographics to life through animation, and create fresh infographics from unexpected sources.
- Stay inspired. Check out these great examples of B2B infographics, technology infographics, and more.
- Work smarter, not harder. Bookmark these 100 tools and resources to create stellar infographics.
- Continue to improve the way you work. See our guide to optimize your content creation process and make things run as smoothly as possible.
If you need a little support, consider bringing in a little help. Here are 10 questions to ask an infographic agency, plus a few tips to work with them effectively. Of course, we wouldn’t mind being in the running. Let’s chat if you want to hear more about how we do things.


Let's upgrade your marketing game
Get fresh tips, how-tos, and expert marketing advice every week. (15,000 people already are.)