41. “Film Dialogue from 2,000 screenplays, Broken Down by Gender and Age”
It’s no secret there’s unrest in Hollywood when it comes to gender. To get more perspective, Polygraph sifted through tons of data to see what’s making the scales so uneven. This interactive infographic lets you see the breakdown by genre, amount of words per gender, and more.

42. “The Largest Vocabulary in Hip Hop”
This visualization by Polygraph allows rappers’ vocabulary to be compared side by side, according to the first 35,000 words of their lyrics. The data can be viewed by artist, by region, etc. You can even measure artists’ vocab compared to Shakespeare!

43. “2016 Primary Forecasts”
The elections are difficult to follow, especially when dealing with fickle polls. The 2016 Primary Forecast interactive created by Nate Silver for FiveThirtyEight shows you the latest polls, which you can explore by state, party, or date.

44. “Eurozone Debt Web: Who Owes What to Whom?”
This interactive created by the BBC gives you an overview of the world’s debt. You can analyze debt by country, then trace it back to its source.

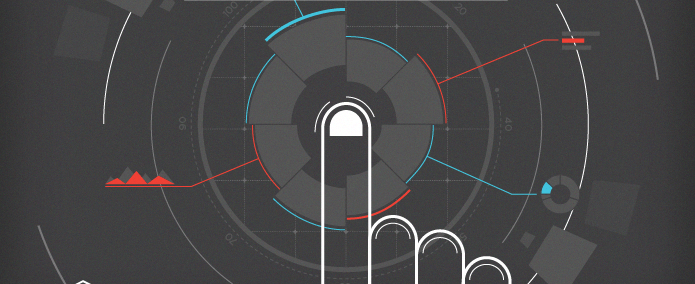
45. “The Network Effect”
This is by far one of the most intriguing interactives on the list. Created by Jonathan Harris and Greg Hochmuth, this interactive is a multi-sensory experience with a time constraint, which makes it all the more exciting. As they explain, “Like the Internet itself, the project is effectively endless, containing 10,000 video clips, 10,000 spoken sentences, news, tweets, charts, graphs, lists, and millions of individual data points, all presented in a classically-designed data visualization environment.”

46. “The Most Timeless Songs of All-Time”
In case you were looking for data-driven proof of the best songs of all time, here it is. This interactive infographic from Polygraph used Spotify data to visualize the most popular songs by decade. You can also look at songs rated by performance, Billboard spot, and awards won.

47. “Counting the Hours: This is How You and America Spend Time Each Day”
It’s easy to lose track of time, especially on the weekends when two days tend to fly by like two hours. This interactive infographic by Nathan Yau (FlowingData) shows a breakdown of how Americans spend their time and on what. The infographic is broken into sections looking at time spent working, cleaning, caretaking, sleeping, and eating.

48. “Graph Ratings of Your Favorite TV Shows”
This interactive infographic by Kevin Wu uses data from IMDB and graphs every season of a show, based on ratings. Simply type in any show that you can think of and voila! There’s a graph.

49. “How Music Taste Evolved”
This interactive timeline by Polygraph follows the most popular songs from 1958-2016. You can jump through the decades and jam out to the most popular songs as they move rank.

50. “Conductor”
Although this may be considered more fun than informative, it still makes the list. Alexander Chen’s interactive turns the subway into a string instrument. The more intertwined the lines become the more interesting the music becomes. Click and drag to create your own tune.

51. “Decibels & Decimals”
This awesome interactive created by Brady Fowler visualizes the relationship between listener’s habits and artist similarities on Spotify. Scroll through this tangled web and maybe you’ll find your new favorite artist.

52. “Common MythConceptions: World’s Most Contagious Falsehoods”
The best infographics are the ones that teach you things you didn’t know you needed to learn. David McCandless is back at it again with this interactive infographic, which explores the most prevalent myths.

53. “13 Reasons Why Your Brain Craves Infographics”
Nothing’s better than an interactive infographic that explains why we love infographics. This is a great visual for helping beginners understand the importance of infographics. Brought to you by NeoMam Studios.

54. “The Enlightened Happy Hour: An Interactive Guide To What You’re Sipping”
Happy hour is a time to pretend the world outside doesn’t exist, but a calorie check is a great way to bring you back down to Earth. Column Five’s boozy interactive allows you to drink smarter.

55. “Beneath the Thinking Cap: The Basic Functions of the Brain”
What’s cooler than using your brain to study the functions of the brain? This interactive by OnlineCollegeCourses breaks down the complex functions of the brain for easier comprehension.

56. “The Bright Future of Car Sharing”
This interactive encourages car sharing by letting you “drive” through the interactive, using the arrow keys on your keyboard. It features tons of information alongside simple illustrations, created by Hyperakt and Collaborative Fund.

57. “Stereotropes”
This interactive by Boucoup is an incredibly detailed breakdown of TV tropes, by gender. Based on info from TVtropes.org, it’s a fascinating exploration of the gendered archetypes depicted in media.

58. “The Scale of the Universe 2”
Nothing will make you feel more insignificant than seeing the size of your body scaled alongside the entire universe. Cary Huang’s interactive lets you zoom in or out to compare the size of things in the universe. It’s mindboggling—and even more impressive considering Huang was 14 when he created it.

59. “Project Ukko: Seasonal Wind Predictions”
Wind power is underutilized in many ways. This interactive map explains the basics. The project was created by EUPORIAS to help close the gap between users and scientists.

60. “Watch How the Measles Outbreak Spreads When Kids Get Vaccinated”
The Guardian created this interactive to simulate the effectiveness of vaccines when attempting to prevent a measles outbreak. The graphic shows 10 different communities with varied vaccination rates, including who would and wouldn’t be protected.


Let's upgrade your marketing game
Get fresh tips, how-tos, and expert marketing advice every week. (15,000 people already are.)